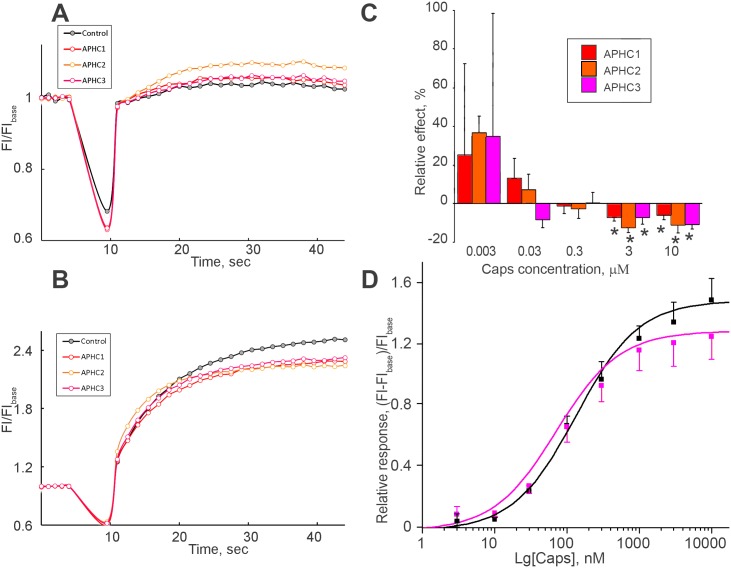
Fig 2. Bimodal action of APHC3 on capsaicin-evoked response of TRPV1.
[Ca2+] responses of rTRPV1-CHO cells to 3 nM capsaicin (A) and 3 μM capsaicin (B) alone (control) and in the presence of 500 nM APHC1, APHC2, APHC3. [Ca2+] responses were measured as changes in fluorescence intensity before (FIbase) and after agonist addition (FI). The data shown are representative average plots (n = 4) of the fluorescence signals against time during assays. C, Chart values of inhibiting/activating effects of APHC 1–3 (500 nM) relative to control in dependence on capsaicin concentration applied. In all graphs the values are given as mean ± SD of at least 5 independent experiments. Reliability (*) was checked by ANOVA followed by Tukey’s post hoc analysis, p = 0.05. D, “Dose-response” of TRPV1 activation by capsaicin alone (black squares) and in the presence of 500 nM APHC3 (red squares) determined in Fluo-4 based intracellular calcium assay tests. Relative responses were measured as (FI- FIbase)/FIbase, where FI is the measured peak fluorescence intensity after agonist addition, FIbase—fluorescence intensity of the cells before agonist addition. Data are expressed as mean ± SD (n = 4–8).

