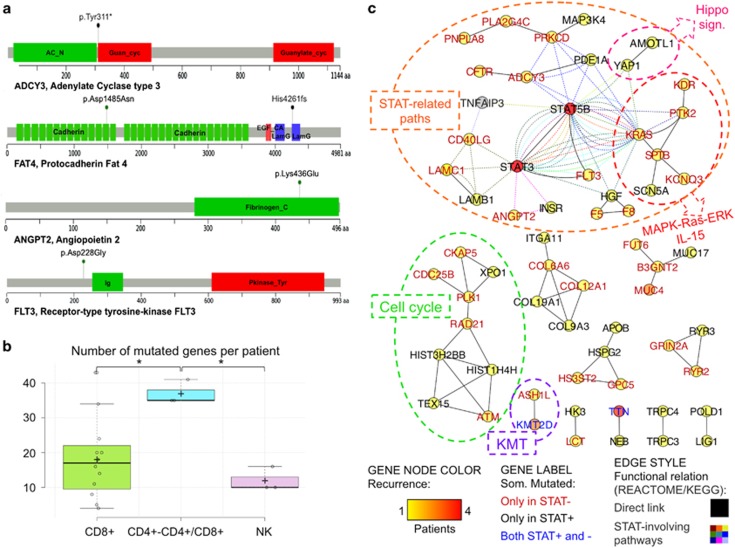
Figure 2.
(a) Impact of selected somatic variants to protein products. Lollipop plots show the type and the position of somatic variants of four selected genes in relation to the protein sequence and domain structure (see Supplementary Figure 5 for an extended version of the figure including additional genes). The ADCY Tyr311* variant induces a very premature stop preventing the synthesis of the protein region including Guanylate cyclase, ATP and Mg2+domains; FAT4 presents two variants, the high-impact missense variant Asp1485Asn in the Cadherin 14 domain and the frameshift variant Hys4261fs inducing a stop codon before Laminin G-like domain truncating the protein before the EGF-like 6 domain and the C terminal; ANGPT2 presents the high-impact missense variant Lys463Glu in Fibrinogen C-terminal domain implicated in protein–protein interactions, and FLT3 shows a high-impact Asp228Gly variant. (b) Number of mutations per patient in each class. Normal distribution of values was confirmed with the Shapiro–Wilk test (P=0.099). Both analysis of variance (P=0.009) and pairwise Tukey s.d. post hoc tests (P-values 0.010 and 0.019 in the comparisons of CD4+/CD4+CD8+ with NK and CD8+, respectively) confirmed the statistical significance of the observed difference. (c) LGL leukemia mutation network. The network shows the functional relations of genes somatically mutated in LGL leukemia patients, according to the integration of KEGG and Reactome pathway topology (see the text and Supplementary Methods for details on the pathway-derived network reconstruction procedure); network nodes represent somatically mutated genes, node color indicates recurrence (according to the legend heat color scale) in the cohort, node label indicates the gene Symbol (different label colors indicates genes that are mutated only in STAT-mutation-positive (STAT+), only in STAT-mutation-negative (STAT−) or in both patient groups, as shown in the legend); genes are connected with black solid lines if they are directly connected in KEGG- and/or Reactome-derived networks or with colored dashed lines if they participate in pathways including STAT3 and/or with STAT5B (see Supplementary Figure 6 for a detailed version of the network).

