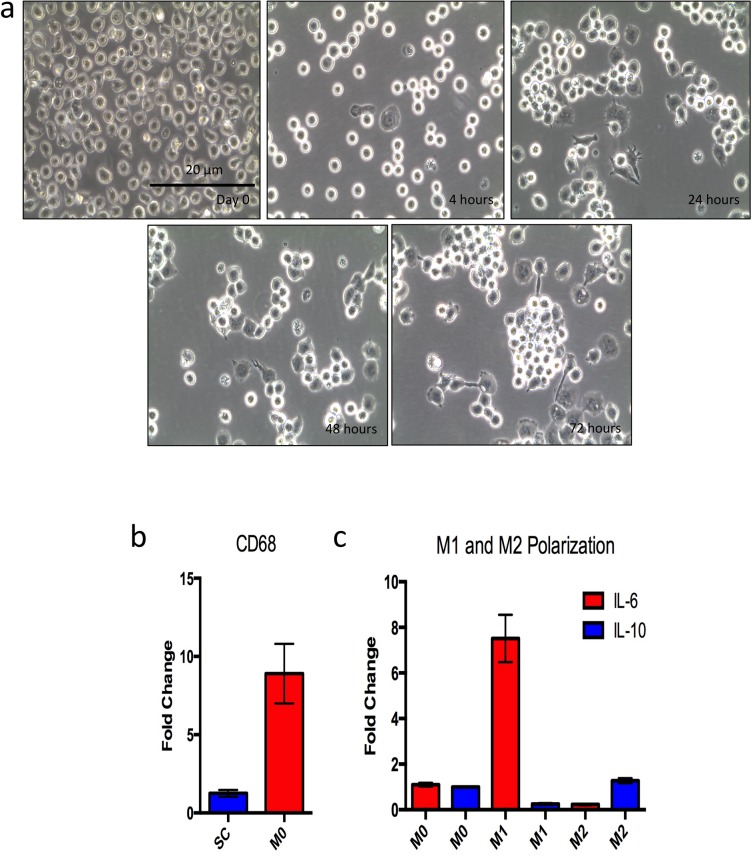
Fig 3. Monocyte to macrophage differentiation and polarization.
SC monocytes were stimulated for 48 hours with 10 ng/mL PMA to achieve differentiation to macrophages. Macrophages were rested for 24 hours in DMEM 10% FBS with no PMA before experiments. A) Morphological changes observed over the differentiation timeline; day 0 shows monocytes before PMA treatment. The subsequent images show time after PMA stimulation. B) qPCR analysis of CD68 gene expression in SC derived M0 macrophages compared to SC monocytes. RNA was isolated from SC monocytes and SC M0 macrophages, and total RNA was used as a template for cDNA synthesis. Real time qPCR analysis was performed, and CD68 expression was normalized to GAPDH. Fold change was set relative to SC monocyte CD68 expression. C) M1 and M2 polarization of SC M0 macrophages. M1 macrophages were differentiated using 20 ng/mL IFN-γ for 24 hours. M2 macrophages were generated using 20 ng/mL each of IL-4 and IL-13 for 24 hours. qPCR was performed to analyze expression of M1 and M2 genes. IL-6 was used as a classical M1 marker, while IL-10 was used as a classical M2 marker.

