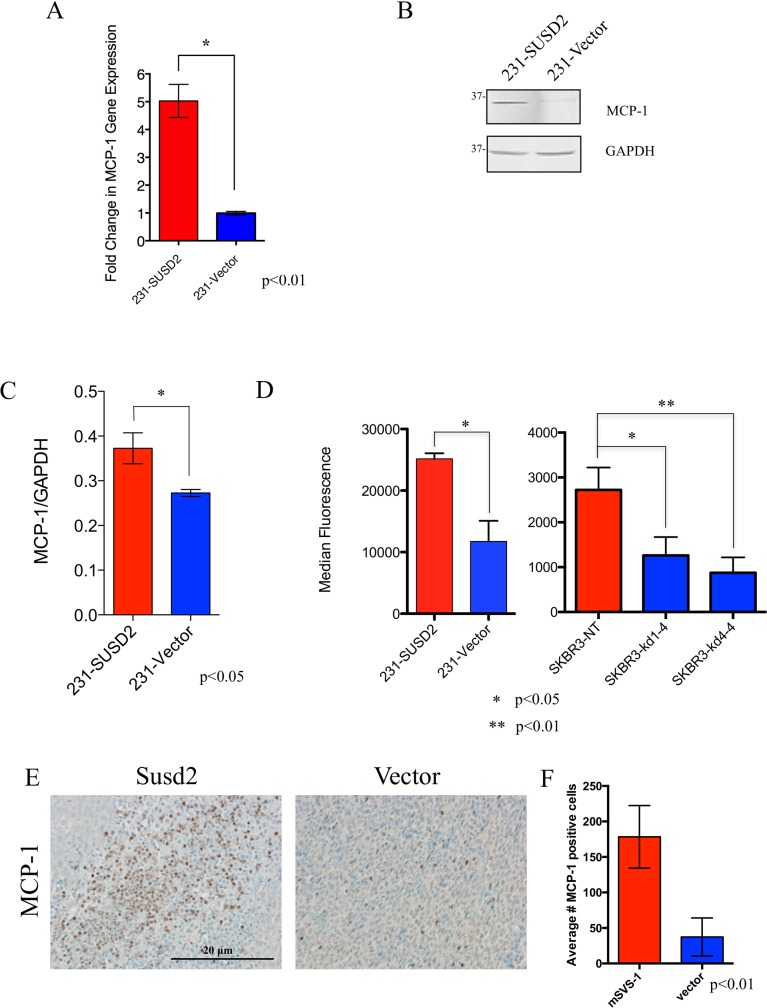
Fig 5. Cells that express SUSD2 produce increased levels of MCP-1.
(A) Effect of SUSD2 on MCP-1 RNA levels. RTqPCR analysis of MCP-1 using cDNA isolated from MDA-MB-231-SUSD2 and vector cell lines was performed. Results were normalized to GAPDH and were reported as fold-change over vector. (B) Western immunoblot analysis of MCP-1 levels. Protein lysates generated from MDA-MB-231-SUSD2 and vector cell lines were used to perform western immunoblot analysis using an anti-MCP-1 antibody. GAPDH served as a loading control. (C) Protein bands from panel b were quantified by densitometry, and values are indicated relative to those of GAPDH. Blots were performed in triplicate, and a student’s t-test was used to test for significance. Error bars indicate SEM. (D) Luminex analysis of MCP-1 in cell culture supernatants. MCP-1 levels present in the supernatant of MDA-MB-231-SUSD2, MDA-MB-231-vector, SKBR3-NT, SKBR3 KD1-4 and SKBR3 KD4-4 were measured with an anti-MCP-1 Luminex assay. Results show data from two independent experiments measuring a minimum of 50 beads per assay. (E) IHC staining of MCP-1 in 66CL4-Susd2 (left) and 66CL4-vector (right) tumors excised from syngeneic BALB/c mice. Representative images were taken at 200x magnification. (F) Quantification of MCP-1 IHC in BALB/c mouse tumors. Three representative MCP-1 IHC images were quantified from both 66CL4-Susd2 and 66CL4-vector tumors.

