
Fig. 3.
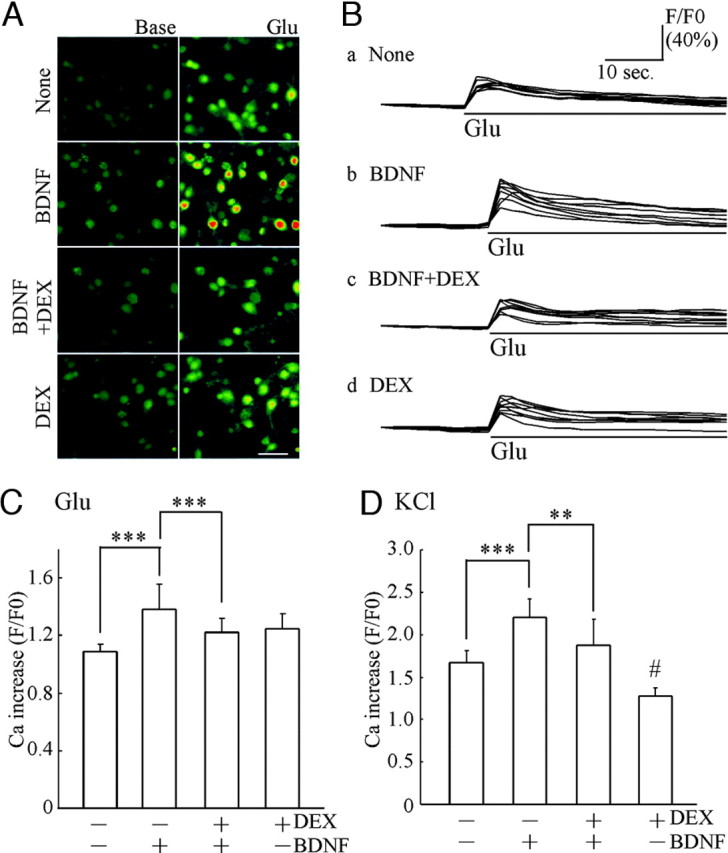
DEX Decreased the BDNF-Potentiated Ca2+ Increase Triggered by Glutamate or High KCl Stimulation
A, Intracellular Ca2+ mobilization was monitored after Fluo-3 loading. Left, Basal intensity of fluorescence in Fluo-3-filled cells for each experimental condition; right, images after glutamate (final 1 μm) stimulation. These images were obtained 4 sec before (Base) and after glutamate stimulation (Glu), respectively. Bar, 50 μm. B, Time-course analysis of intracellular Ca2+ before and after glutamate addition. Each trace indicates the representative intensity of fluorescence from nine neurons in untreated cultures (none) (a) and cultures pretreated with BDNF (b), BDNF plus DEX (c), and DEX (d). Bars indicate exposure time to glutamate. Data are shown as a ratio (F/F0; intensity after stimulation/ basal intensity before stimulation). C, Quantitative analysis of Ca2+ increase induced by glutamate (1 μm). Enhancement of intracellular Ca2+ increase was observed in BDNF-treated cultures. Pretreatment of DEX (1 μm) inhibited the BDNF-potentiated Ca2+ increase. Data represent mean ± sd. Fluorescent intensity was measured from cells in a sister culture (n is the number of cells selected randomly): none, n = 33; BDNF, n = 46; BDNF plus DEX, n = 48; DEX, n = 49. ***, P < 0.001 (Kruskal-Wallis test and Mann-Whitney U test). The Ca2+ imaging analysis was performed at DIV7 (5 d after BDNF application). D, KCl-induced Ca2+ increase was also potentiated by BDNF and inhibited by DEX. High potassium (high KCl solution, final 50 mm) was applied to induce cell depolarization. Data represent mean ± sd. None, n = 9; BDNF, n = 13; BDNF plus DEX, n = 8; DEX, n = 11. ***, P < 0.001; **, P < 0.01; #, P < 0.05 (none vs. DEX), Kruskal-Wallis test and Mann-Whitney U test.