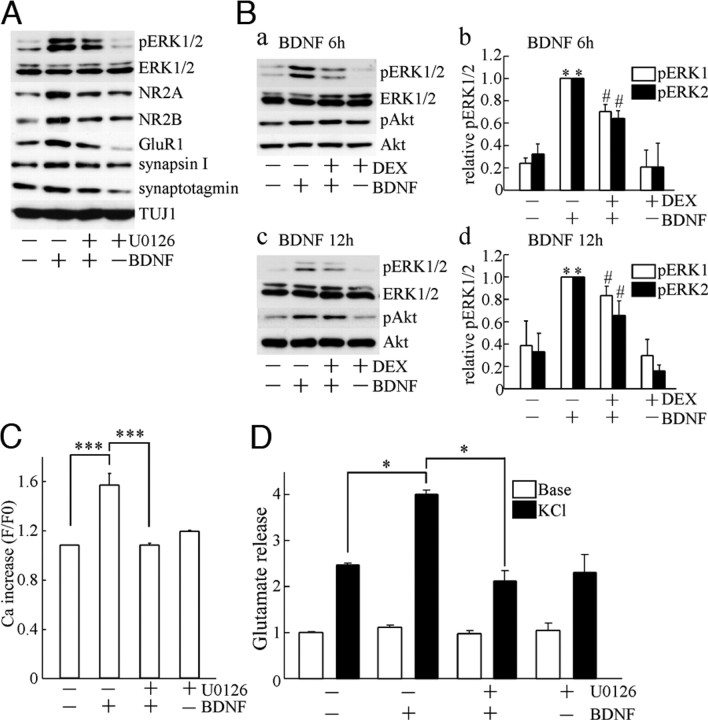
Fig. 7.
Inhibitory Effect of DEX on the Action of BDNF Was via Reducing Activation of the MAPK Pathway
A, U0126 (a specific inhibitor of MAPK kinase, an upstream molecule of MAPK/ERK) suppressed the phosphorylation of ERK1/2 (pERK1/2) and the increases of synaptic proteins induced by BDNF. BDNF-up-regulated NR2A, NR2B, GluR1, synapsin I, and synaptotagmin was prevented by U0126. No change of total ERK1/2 was observed. U0126 (final 10 μm) was applied 20 min before BDNF addition. BDNF was added at DIV2. Forty-eight hours later, samples for immunoblotting were collected. B, BDNF-stimulated ERK activation was decreased by DEX (10 μm) pretreatment. a, Levels of pERK1/2, ERK1/2, pAkt, and Akt at 6 h after BDNF treatment are shown. DEX was applied at DIV1, and then BDNF was added at DIV2. The ERK1/2 activation was suppressed by DEX, whereas the Akt activation was intact. b, Quantitative analysis of activated ERK1/2 at 6 h was performed. Data represent mean ± sd; n = 4. *, P < 0.05 vs. basal pERK1/2 in untreated cells (without BDNF or DEX); #, P < 0.05 vs. BDNF-stimulated pERK1/2 without DEX pretreatment, Kruskal-Wallis test and Mann-Whitney U test. c, Activation of ERK1/2 and Akt at 12 h after BDNF application. The activated ERK1/2 by BDNF was still observed, and DEX inhibited the BDNF-activated ERK1/2. DEX did not affect the Akt activation by BDNF. d, Quantitative analysis of activated ERK1/2 at 12 h after BDNF application. Data represent mean ± sd; n = 4. *, P < 0.05 vs. basal pERK1/2 in untreated cells (without BDNF or DEX); #, P < 0.05 vs. BDNF-stimulated pERK1/2 without DEX pretreatment, Kruskal-Wallis test and Mann-Whitney U test. C, BDNF-potentiated Ca2+ increase required activation of the MAPK pathway. U0126 canceled the BDNF-potentiated Ca2+ increase. U0126 was applied 20 min before BDNF addition at DIV2. Ca2+ imaging was carried out at DIV7 (5 d after BDNF application). None, n = 50; BDNF, n = 50; BDNF plus DEX, n = 50; DEX, n = 50. The n indicates the number of cells. Data represent mean ± sd. ***, P < 0.001, ANOVA. D, BDNF-potentiated glutamate release was blocked by U0126. U0126 and BDNF were applied as indicated in C; n = 4. The n indicates the number of wells for each experimental condition on a plate. *, P < 0.05, Kruskal-Wallis test and Mann-Whitney U test.

