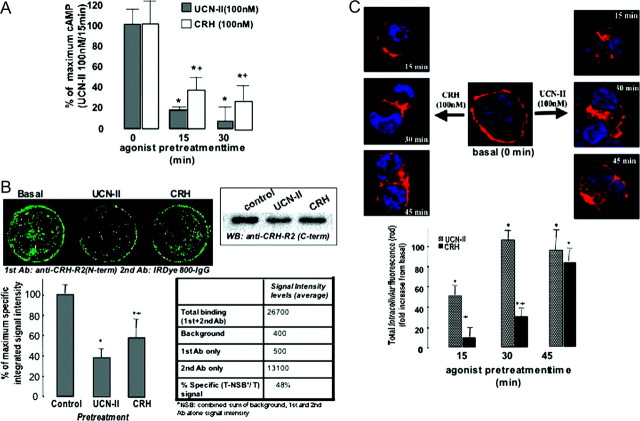
Fig. 2.
Desensitization and Internalization Characteristics of CRH-R2β Stably Expressed in HEK293 Cells
Cells were pretreated with CRH or UCN-II (100 nm) for various time intervals (2–45 min). A, After extensive washing, cAMP response to a second UCN-II stimulus (100 nm for 15 min) was determined. Data represent the mean ± sem of two estimations from three independent experiments. *, P < 0.05 compared with cells without pretreatment; +, P < 0.05 compared with each other’s agonist pretreatment. B, Alternatively, CRH-R2β distribution was monitored over the ensuing time period by indirect immunofluorescence using specific primary antibodies and Alexa Fluor 594 secondary antibodies for CRH-R2β (red). Identical results were obtained from four independent experiments. For quantification of cytoplasmic CRH-R2β, 20 individual cells in five random fields of view were examined. *, P < 0.05 compared with cells without pretreatment; +, P < 0.05 compared with each other’s agonist pretreatment. C, CRH-R2β loss from the cell surface after agonist stimulation (UCN-II or CRH, 100 nm) for 30 min was quantified by an On-cell Western assay with near-IR dyes in nonpermeabilized cells, using antibodies against the CRH-R2β N terminus and the Odyssey IR imaging system. In the right panel, the IR-specific signal intensity characteristics are presented. Data represent the mean ± sem of two estimations from three independent experiments. *, P < 0.05 compared with cells without pretreatment; +, P < 0.05 compared with each other’s agonist pretreatment. Inset, After agonist stimulation, cell membrane-rich fractions were immunoblotted with antibodies against CRH-R1/2 C terminus. Identical results were obtained from four independent experiments.

