
Fig. 8.
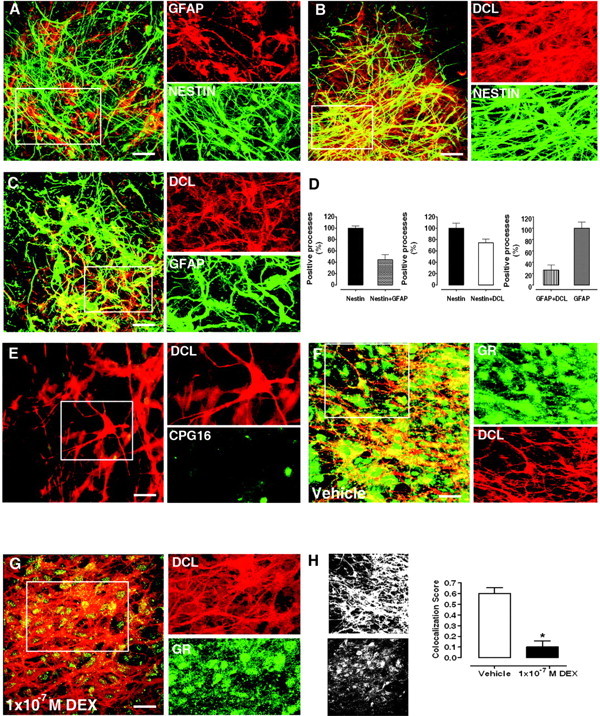
Characterization of DCL-Expressing Cells in the Hilar Region of DIV5 Rat Hippocampal Organotypic Slice Cultures
A, Colocalization of GFAP (red) and nestin (green). B, Colocalization of DCL (red) and nestin (green). C, Colocalization of DCL (red) and GFAP (green). D, Proportions of cellular processes positive for nestin, GFAP, and/or DCL. Cellular processes were selected as areas of interest for score calculations. E, Characterization of DCLK isoforms expressed. Inset, weak signal observed for kinase domain-containing isoforms (CPG16, green) and lack of colocalization to the DCL (red) in processes. F, Colocalization of GR (green) and DCL (red). Inset, distribution of GR in cellular processes in vehicle-treated slices. G, DEX-induced GR translocation. Inset, decrease in GR (green) localization in cellular processes (DCL, red) as compared with F. H, Grayscale bitmaps from panels F (top) and G (bottom) and the corresponding GR/DCL colocalization scores in cellular processes. *, P < 0.05. Scale bars, 20 μm in A, B, C, F, and G; 32 μm in E.