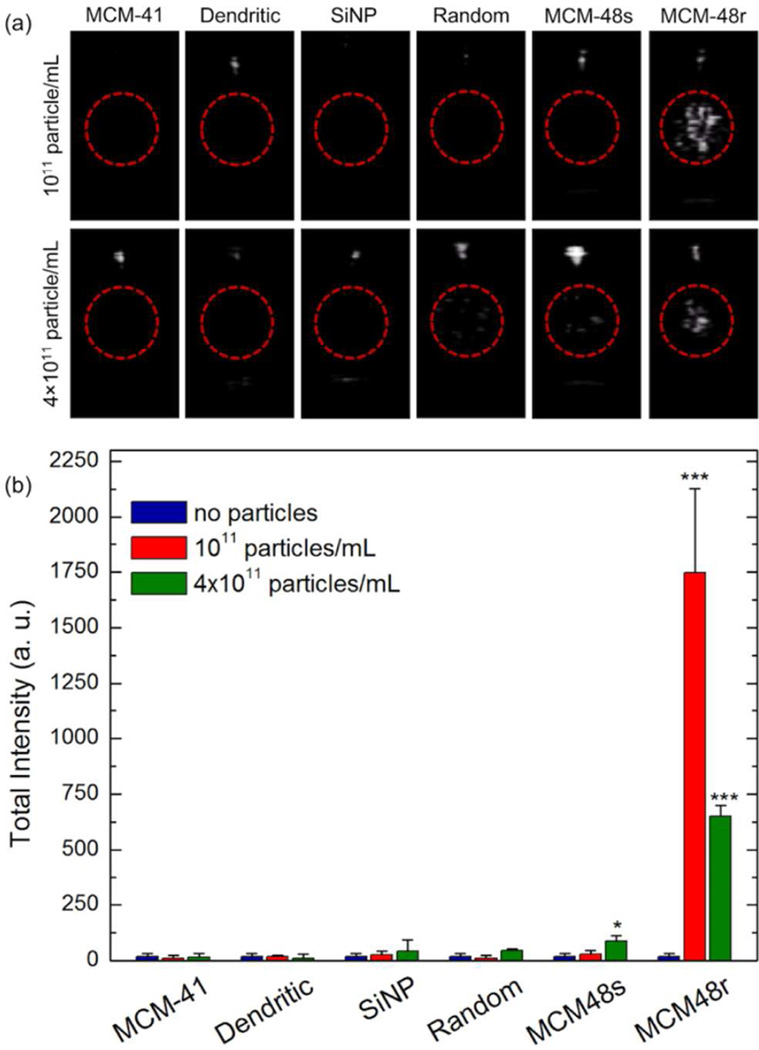
Figure 2.
(a) Representative images taken from movies acquired during HIFU insonation of nanoparticles at two different concentrations. Red circles mark the region of interest (ROI), or the area shows the focus of the HIFU. The white spot above the ROI is due to reflection from the sample tube wall. (b) Calculated total intensities from the acquired movies of the samples at two different particle concentrations. Error bars = 1 SD, studies were run in triplicate. Student’s t test was applied to the data; * indicates p<0.05 and *** indicates p<0.0001.

