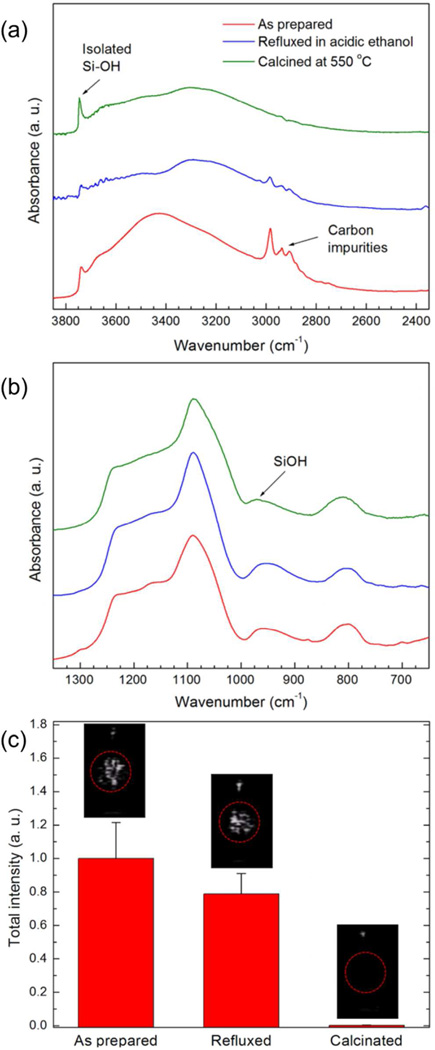
Figure 6.
FTIR spectra of the as-prepared, refluxed in acidic ethanol, and calcined MCM-48R. (a) The range of FTIR spectra (3850-2450 cm−1) showing the isolated and interacting hydroxyl and carbon impurity absorption bands of the nanoparticles. (b) The range of FTIR spectra (1400-700 cm−1) showing the hydroxyl and siloxane absorption bands of the nanoparticles. (c) Calculated total intensities from the acquired movies of the as prepared, refluxed in ethanol, and calcinated MCM-48R samples at a particle concentration of 1011 particles mL−1. Insets are the representative images taken from movies acquired during HIFU insonation. Red circles mark the region of interest. Error bars = 1 SD, studies were run in triplicate.

