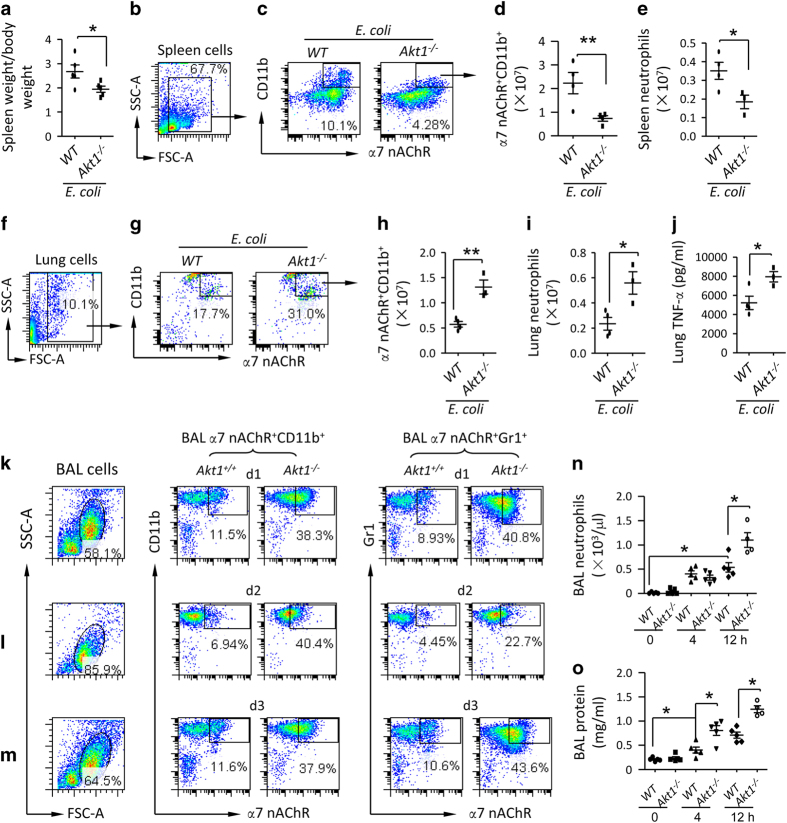
Figure 5.
Deficiency of AKT1 facilitates release of α7 nAChR+CD11b+ cells from spleen and recruitment of these cells to the injured lungs. (a–e) Deficiency of AKT1 reduces splenic α7 nAChR+CD11b+ cells. The wildtype and Akt1−/− mice were challenged with an IT of E. coli (2.5×10⁶ cfu), and were killed 24 h later. The spleen/body weight ratio was compared (a). The spleen cells were labeled with anti-α7 nAChR and CD11b fluorescent antibodies. The whole-cell population was gated to analyze α7 nAChR+CD11b+ cell population (b, c). The percentage multiplied counts of splenocytes to obtain absolute number of α7 nAChR+CD11b+ cells (d). Spleen neutrophils were counted by Wright’s staining (e). N=3–4 in each group. *P<0.05, **P<0.01, Student’s t-test. Data are presented as mean±s.d. (f–j) Deficiency of AKT1 enhances recruitment of α7 nAChR+CD11b+ cells and neutrophils to the lung and lung TNF-α level. The lung cells were labeled with anti-α7 nAChR and CD11b fluorescent antibodies. The whole-cell population was gated to analyze α7 nAChR+CD11b+ cell population (f, g). The percentage multiplied counts of splenocytes to obtain absolute number of α7 nAChR+CD11b+ cells (h). Lung neutrophils were counted by Wright’s staining (i) and TNF-α levels were measured by ELISA (j). N=3–4 in each group. *P<0.05, Student’s t-test. Data are presented as mean±s.d. (k–m) Effect of deficiency of Akt1 on α7 nAChR+CD11b+ and α7 nAChR+Gr1+ cell population in the BAL during E. coli pneumonia. The wildtype and Akt1−/− mice were challenged with an IT of E. coli (2.5×10⁶ cfu). The mice were killed at d 1, 2 and 3 after E. coli challenge. The BAL was collected to harvest BAL cells for flow analysis. The cells were labeled with anti-α7 nAChR, CD11b and Gr1 fluorescent antibodies. The whole-cell population was gated. α7 nAChR+CD11b+ and α7 nAChR+Gr1+ cells were analyzed at d 1(k), d 2(l) and d 3(m) in the BAL cells. (n, o) Effect of deficiency of AKT1 on BAL neutrophils and protein in LPS-induced ALI. Wildtype and Akt1-deleted mice were IT challenged with LPS (5 mg kg−1). The mice were killed at 4 and 12 h after LPS challenge. BAL was collected to measure neutrophil count (n) and protein levels (o). N=4–5 in each group. *P<0.05, Student’s t-test. Data are presented as mean±s.d.

