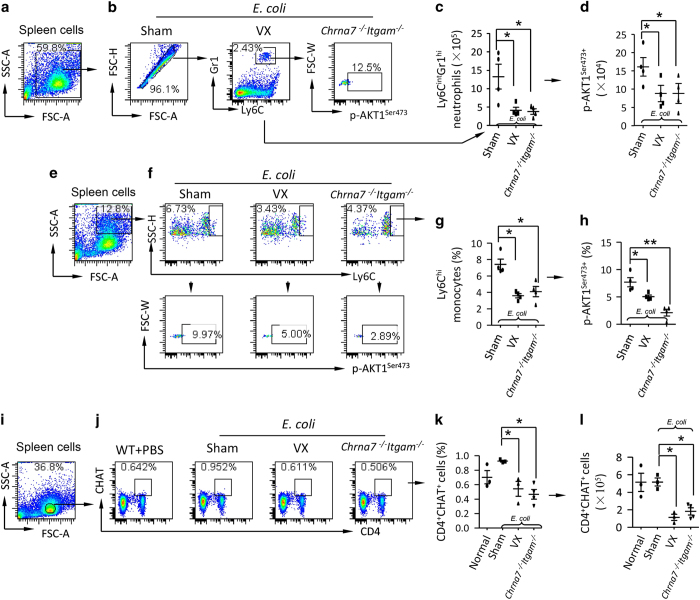
Figure 7.
Vagotomy and double deletion of Chrna7 and Itgam reduce p-AKT1Ser473+ neutrophils and monocytes and ACh-producing CD4+CHAT+ cells during E. coli pneumonia. (a–d) Flow cytometry analysis of AKT1Ser473phosphorylation in splenic neutrophils. The sham, vagotomized and Chrna7−/−Igtam−/− mice were IT challenged with E. coli (2.5×10⁶ cfu). The mice were killed at 24 h after E. coli challenge. Spleen cells were collected and labeled with fluorescent antibodies. (a) Whole-cell population was gated. (b) Ly6CIntGr1hi neutrophils were grouped, then subgated p-AKT1Ser473+ cells. (c) Number of splenic Ly6CintGr1hi neutrophils. (d) Number of p-AKT1Ser473+ cells in Ly6CintGr1hi gate. N=4 in each group, *P<0.05. Data are presented as mean±s.d. (e–h) Flow cytometry analysis of AKT1Ser473phosphorylation in splenic monocytes. Using the same experimental setting as (a–d), granular cells were gated (e). Ly6Chi monocytes were grouped, then subgrouped for p-AKT1Ser473+ monocytes (f). (g) Percentage of BAL monocytes. (h) Percentage of p-AKT1Ser473+ monocytes was presented. N=4 in each group, *P<0.05, **P<0.01. (i–l) Flow cytometry analysis of splenic ACh-producing CD4+CHAT+cells during E. coli pneumonia. Using the same experimental setting as (a–d), the four groups of spleen cells were subjected to flow cytometric analysis. (i) Lymphocyte population was gated. (j) CD4+CHAT+ cells were subgated. (k) Percentage of splenic CD4+CHAT+ cells. (l) Number of CD4+CHAT+ cells was calculated by multiplying the percentage with total spleen cell counts. N=4 in each group, *P<0.05. Data are presented as mean±s.d.

