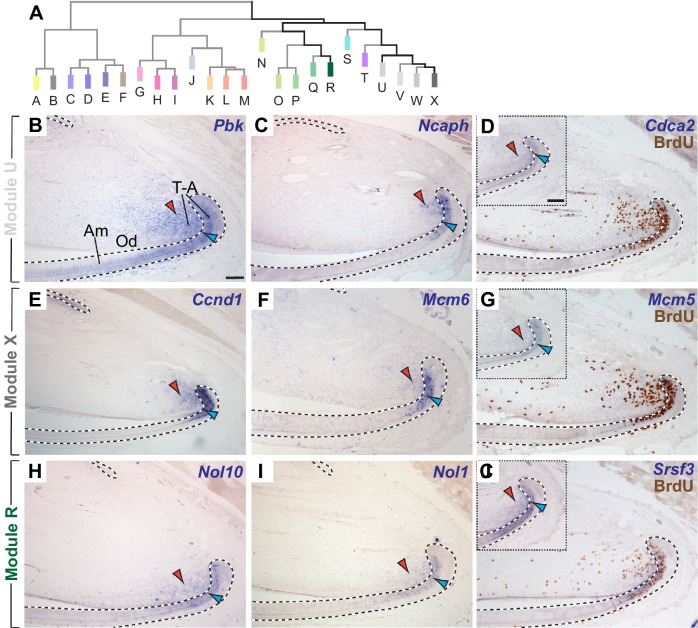
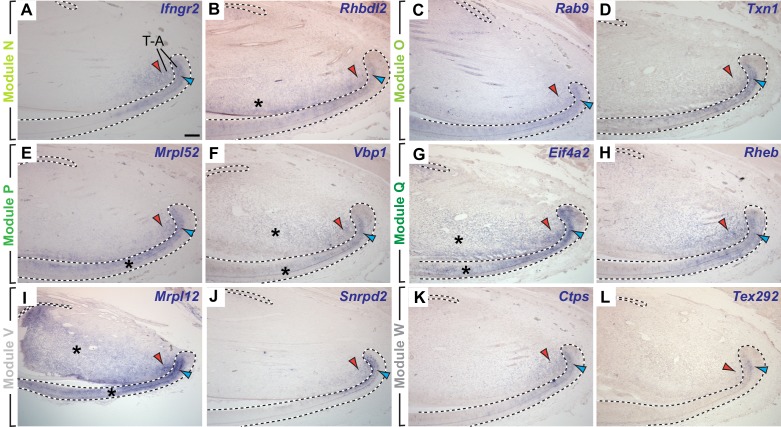
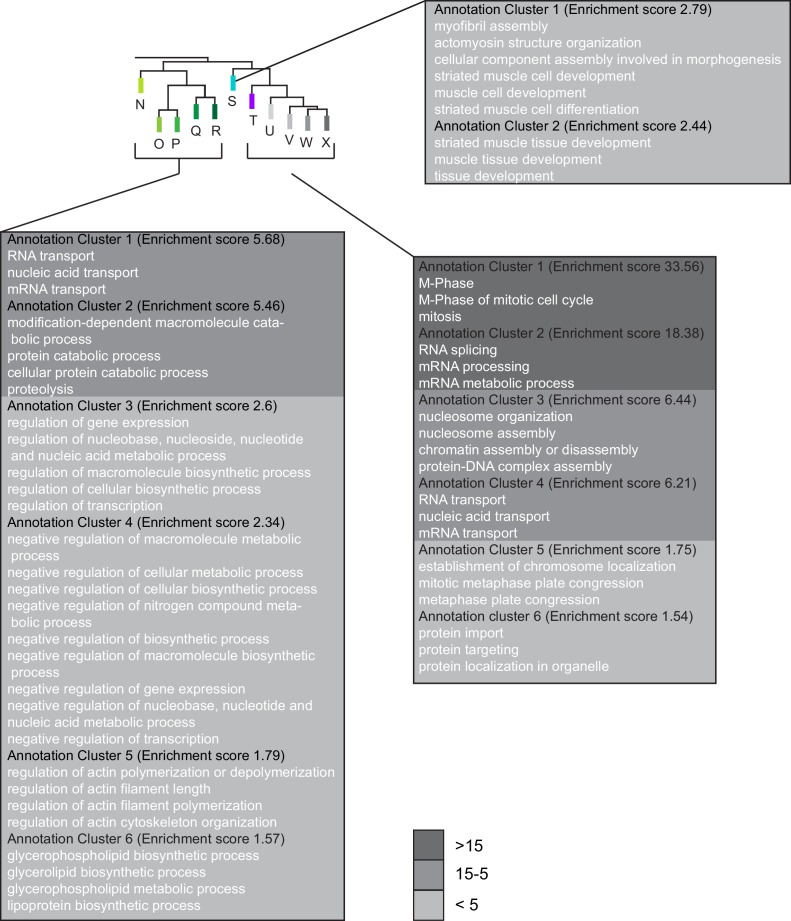
Figure 3. The incisor gene co-expression network contains several modules of genes co-expressed in transit-amplifying (T–A) cells.
(A) Highly ranked genes contributing to modules clustered in the right-hand portion of the dendrogram are expressed in regions with actively proliferating epithelial and mesenchymal T-A cells. (B–D) mRNA expression of genes highly ranked in module U is detected in T-A cells in the incisor epithelium (blue arrowhead) and mesenchyme (red arrowhead). (E–G) In situ hybridization for highly ranked genes contributing to Module X. (H–J) Transcription of genes in Module R is restricted to T-A cells. In situ hybridization and antibody staining against BrdU (D,G,J) confirm expression of Cdca2, Mcm5 and Srsf3 in proliferating cells. Insets show mRNA expression prior to detection of BrdU on same tissue section. Dashed lines delimit ectodermal epithelium. Am, ameloblasts; Od, odontoblasts, T-A, transit-amplifying cells. Scale bars: 100 μm, C-J as in B; insets in G, J as inset in D.


