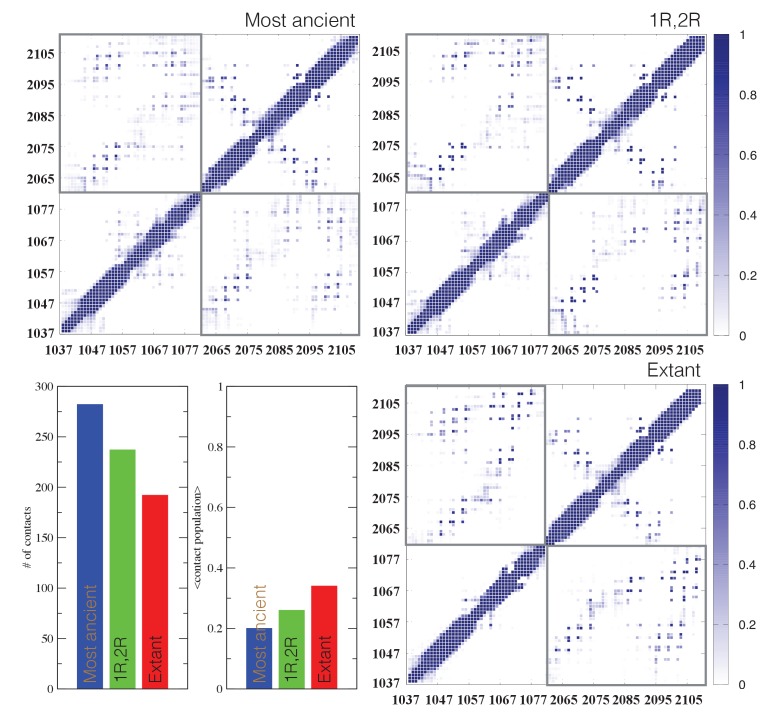
Figure 10. Contact analysis for ancient and extant CID/NCBD complexes.
The probability contact maps are shown for each pair of residues for (upper left) the most ancient complex (1R CID and D/P NCBD), (upper right) the 1R/2R complex and (lower right) the extant NCOA3 CID/CREBBP NCBD complex. Inter-domain contacts are framed by gray rectangles. Given two residues in a certain conformation, a contact is defined as a distance within 0.5 nm (excluding hydrogen atoms). Lower left panels: The total number of inter-domain contacts (left) and the inter-domain average contact formation (right) are reported as the number of residues with a contact populated more than 5% and the average over population for the same contacts, respectively.

