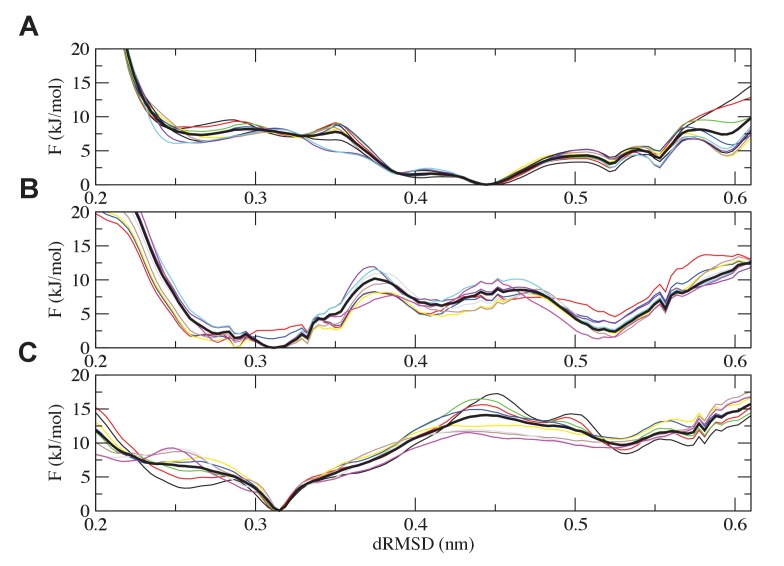
Figure 13. Analysis of the convergence of the simulations.
Free-energy plots along the dRMSD collective variable for the second half of the simulations are shown for (A) the most ancient complex (1R CID and D/P NCBD), (B) the 1R/2R complex and (C) the extant NCOA3 CID/CREBBP NCBD complex. The solid black curve is the final free energy obtained by averaging over the second half of the simulations. Overall, all the simulations are converged within 3 kJ/mol.

