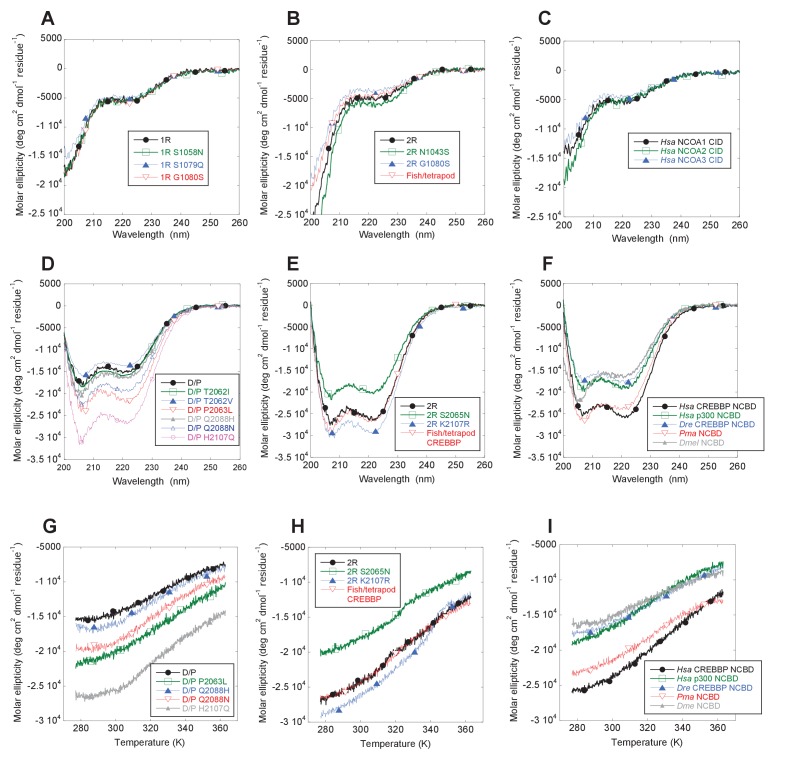
Figure 7. Far-UV Circular dichroism experiments.
(A–C) CD spectra of CID variants display a profile typical for disordered proteins. (D–E) CD spectra of NCBD variants show a qualitatively similar shape for all variants. (G–I) Thermal denaturations of NCBD variants show a similar apparent non-cooperative transition.

