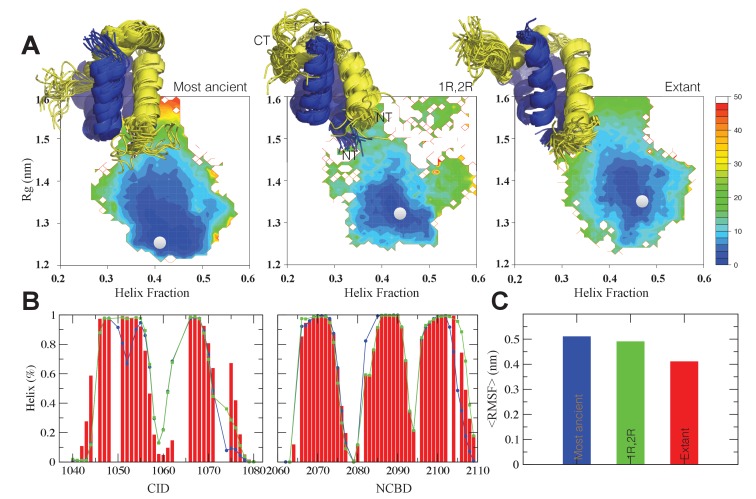
Figure 9. The CID/NCBD complex displays minor structural changes upon evolution.
(A) Free-energy surfaces (in kJ/mol) as a function of the fraction of helix content and the Rg, for the most ancient complex (D/P NCBD and 1R CID), the 1R/2R complex and one extant complex (human NCOA3 CID/CREBBP NCBD). For each free-energy surface, the position of the minimum and a set of representative structures are shown: CID in yellow and NCBD in blue. N- and C- termini (NT and CT, respectively) are labeled for the central ensemble. (B) Per residue helix population of the protein ensembles of the most ancient (blue circles), 1R/2R (green squares) and extant (red bars) variants as predicted by δ2D from the chemical shifts. (C) Average root-mean-square fluctuation for the three variants showing a weak correlation between historical age and conformational heterogeneity of the complex.
DOI: http://dx.doi.org/10.7554/eLife.16059.020


