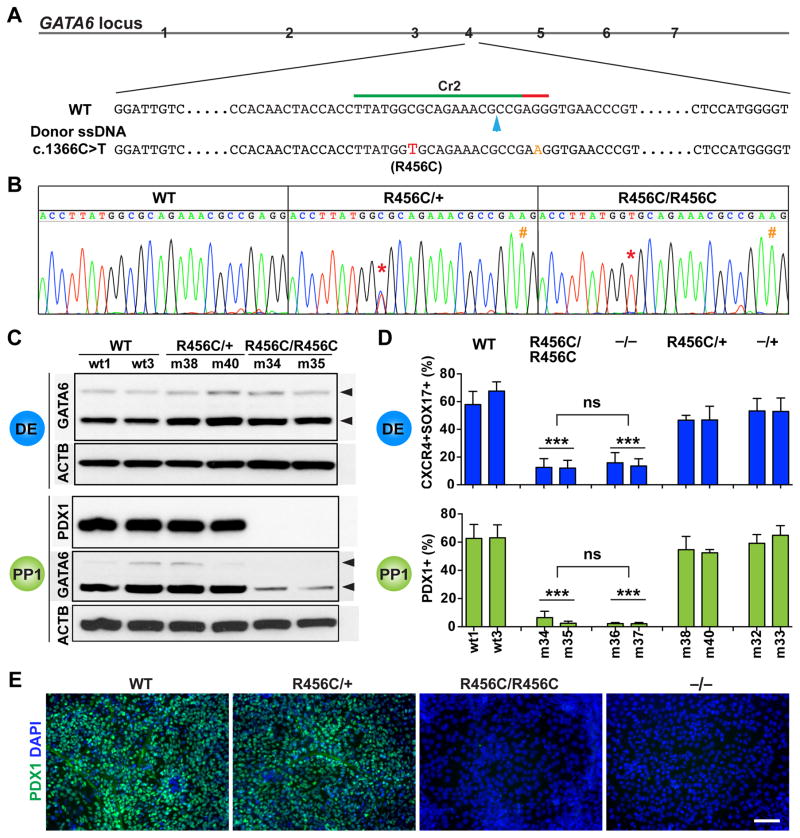
Figure 3. Characterization of the patient-specific GATA6R456C mutation.
(A) Schematic of CRISPR targeting for generating hPSC lines carrying heterozygous and homozygous GATA6R456C mutations. The GATA6R456C missense disease mutation (c.1366C>T, shown in red) was introduced through homology direct repair using a ssDNA donor template (110-nt long). To minimize potential secondary cutting by Cas9 after homologous recombination, a silent mutation (G>A, shown in orange) was introduced in the PAM sequence. The blue arrow indicates the predicted Cas9 cleavage site.
(B) Representative sequencing graphs of generated heterozygous and homozygous mutants carrying the disease mutation. The red * indicates the C>T switch; the orange # indicates the G>A change.
(C) Western blotting showed that GATA6R456C mutant protein was still expressed and detected by the same GATA6 antibody used elsewhere. The cells were differentiated to the DE stage. Western blotting was also used to detect PDX1 and GATA6 expression at the PP1 stage. ACTB was used as a loading control.
(D) FACS quantification of percentages of DE and PP1 cells at the corresponding stages (n=6). For direct comparison and easy visualization, we also included data shown in Figures 2E and 2H for WT, −/+ and −/− genotypes (obtained from the same differentiation experiments). One-way ANOVA was used followed by multiple comparisons with Bonferroni correction for statistics test.
(E) Representative immunostaining images for PDX1 at the PP1 stage.
All data in this figure were generated from HUES8 lines using the 1st-generation differentiation protocol. See also Tables S1 and S2 and Figure S1.

