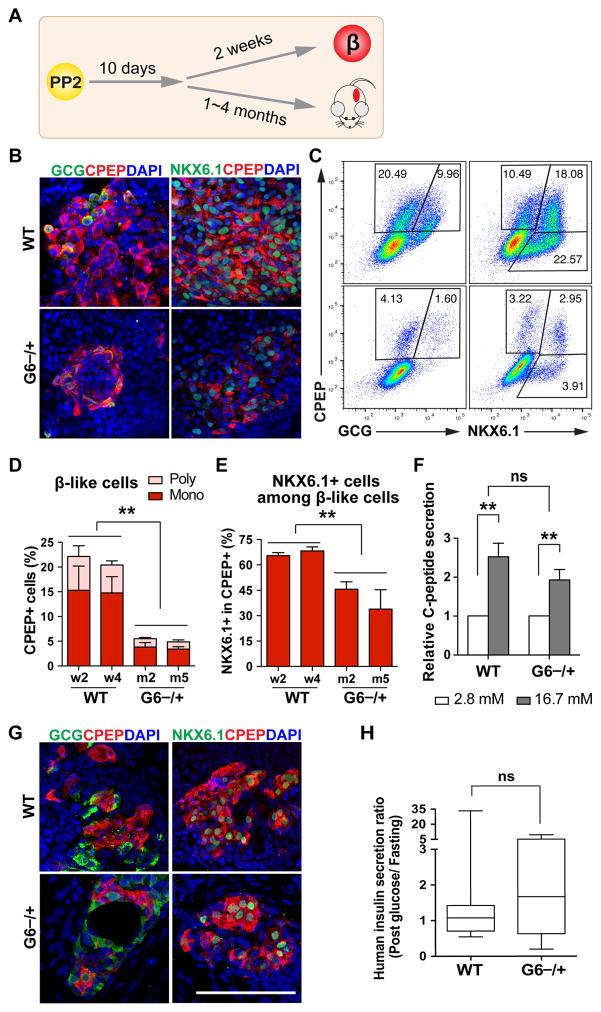
Figure 5. GATA6 haploinsufficiency in the formation of functional β-like cells.
(A) Schematic of hPSC-derived PP2 cell differentiation to β-like cells in vitro and in vivo (after transplantation).
(B) Representative images for CPEP co-staining with glucagon (GCG) or NKX6.1 at the β-like stage in vitro.
(C) Representative FACS dot plots for CPEP co-staining with GCG or NKX6.1 at the β-like stage.
(D) Quantification of FACS analysis for CPEP+ and GCG+ or - cells from 3 independent experiments.
(E) Quantification of FACS analysis for percentage of NKX6.1+ cells within CPEP+ cells from 3 independent experiments.
(F) In vitro GSIS at the β-like stage (n=6). See Figure S4C for associated data.
(G) Representative images for CPEP co-staining with GCG or NKX6.1 of the grafts removed from mouse kidney capsules 4 months after transplantation.
(H) Mouse GSIS experiment at one month after transplantation. Box and whiskers plot for human insulin secretion ratio (post glucose/fasting) in mouse sera. The analysis was done using unpaired two-tailed t test with Welch’s correction (unequal variance) (n=8–10). See raw data for each mouse in Figure S4E.
All data in this figure were generated from H1 lines using the 2nd-generation differentiation protocol. See also Table S3 and Figures S4.

