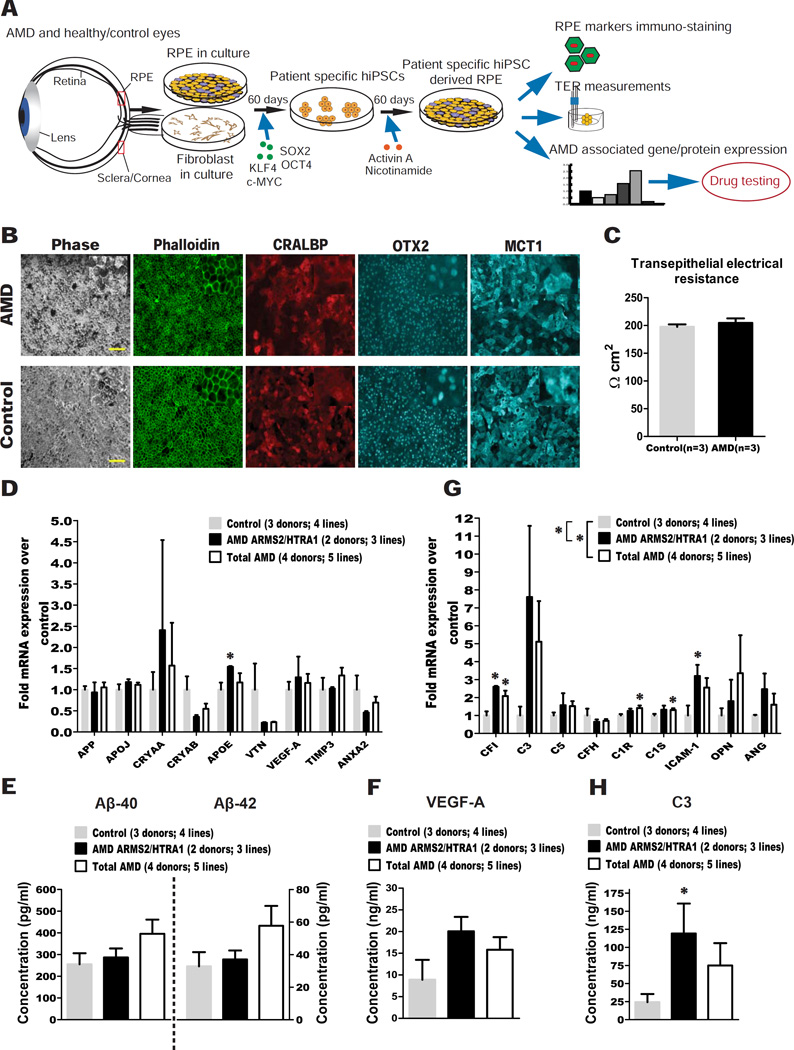
Figure 1. hiPSC-RPE from total AMD and AMD ARMS2/HTRA1 donors express higher levels of disease-related markers compared to controls.
(A) Experiment schematic.
(B) AMD and control hiPSC-RPE stained for Phalloidin, and the RPE markers CRALBP, OTX2 and MCT1 (Scale bar: 100µM). Insets show digitally zoomed high magnification images.
(C) AMD and control hiPSC-RPE showed similar TER.
(D) qPCR analysis of AMD ARMS2/HTRA1 hiPSC-RPE and total AMD hiPSC-RPE versus control hiPSC-RPE for AMD/drusen transcripts.
(E-F) ELISA testing of culture supernatant from AMD ARMS2/HTRA1, total AMD and control hiPSC-RPE obtained 60–72 hours after the last medium change for secretion of Aβ peptides (E) and VEGF-A (F).
(G) qPCR analysis of AMD ARMS2/HTRA1 hiPSC-RPE and total AMD hiPSC-RPE versus control hiPSC-RPE for complement/inflammatory transcripts.
(H) ELISA testing of culture supernatant from AMD ARMS2/HTRA1, total AMD and control hiPSC-RPE obtained 60–72 hours after the last medium change for secretion of C3.
Data are expressed as mean± SEM. Unpaired Student’s t test (one-tailed) (D–H) and two-way ANOVA (D, G) were used for statistical analysis (*= p<0.05).

