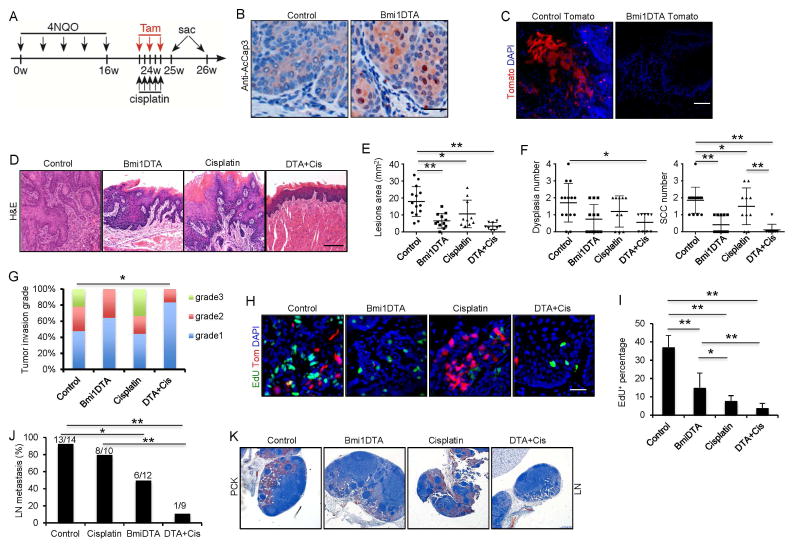
Figure 3. Ablation of Bmi1+ cells in combination with chemotherapy inhibits primary HNSCC growth and lymph node metastasis.
(A) Experimental design for lineage ablation of Bmi1+ cells in HNSCC in vivo. Three administrations of tamoxifen were given to BmiCreER;Rosa26DTA (DTA) or control mice to achieve maximal frequency of Cre-LoxP-mediated cell ablation.
(B) Representative staining for active-caspase3 cells. Scale bar, 50 μm.
(C) Lineage tracing confirmed the depletion of Bmi1+ cells. Scale bar, 50 μm.
(D) Representative H&E staining of HNSCC after treatment. Scale bar, 50 μm.
(E) Quantification of lesion areas visible in the tongue from different treatment groups. Values are mean ± SD. from the pool of two independent experiments (n = 9 to 14). *p < 0.05, **p < 0.01; two-way ANOVA.
(F) Quantification of dysplasia and SCC numbers in the control and DTA groups. Values are mean ± SD. from the pool of two independent experiments (n = 9 to 14). *p<0.05, ** p<0.01; two-way ANOVA.
(G) Quantification of HNSCC invasion grades in different treatment groups. *p < 0.05; Cochran-Armitage test (n = 9 to 14).
(H) Representative images of EdU incorporation (green) and Bmi1+ CSCs (red) in HNSCC from mice treated with different conditions. Scale bar, 50 μm.
(I) Quantifications of EdU percentage in tumor cells after treatments. Values are mean ± SD. from the pool of two independent experiments (n = 9 to 14). *p < 0.05, ** p < 0.01; two-way ANOVA.
(J) The percentage of mice having lymph node metastasis after treatment. *p < 0.05, ** p<0.01; Fisher exact test. Number of mice used in each groups were indicated in the figure;
(K) Immunostaining of metastatic cells in cervical lymph nodes using anti-pan-cytokeratin (PCK). Scale bar, 250 μm.

