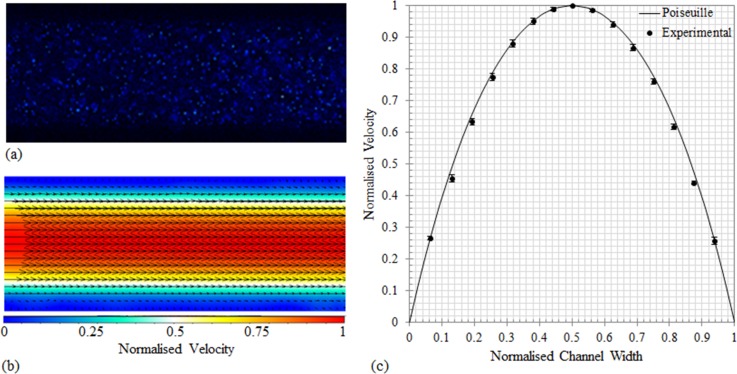
FIG. 2.
(a) Raw image of the 0.5 μm particles flowing in the microchannel, imaged using a 20×/NA = 0.5 objective. (b) The corresponding velocity vectors calculated using the cross correlation method using 500 images pairs. (c) Comparison of the experimental velocity profile, obtained by taking line-by-line averaging along the streamwise direction where the error bars denote standard deviation from the mean, and the analytical solution for Poiseuille flow in a straight square channel. The solid line is the analytical solution for Poiseuille flow. All profiles were acquired at the center of the microchannel at a depth of 50 μm using the same flow conditions.

