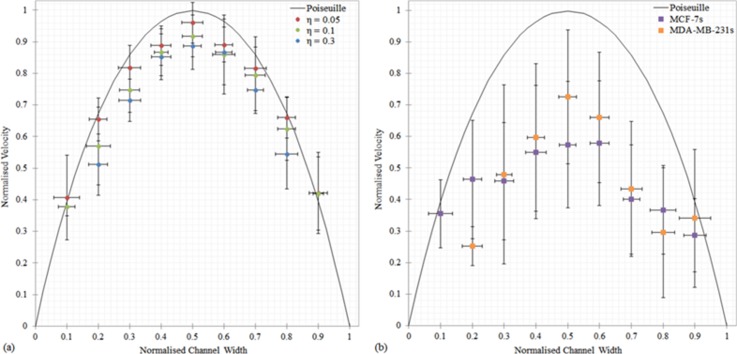
FIG. 5.
Comparison of the flow behavior of (a) the particles (η = 0.05, 0.1, and 0.3), and (b) the MCF-7 (η = 0.03–0.78) and MDA-MB-231 (η = 0.06–0.77) cells, subjected to a flow rate of 0.233 μl/min. All velocities are normalized by dividing them by the maximum velocity and the particle positions are normalized by dividing them by the channel height. The error bars denote the standard deviation from the mean. All profiles were acquired at the center of the channel at a depth of 50 μm.

