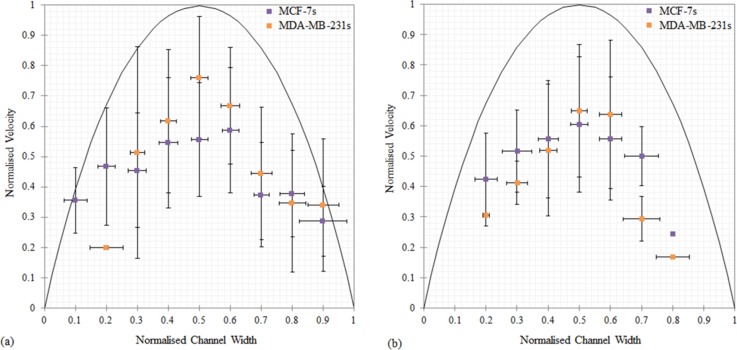
FIG. 6.
Comparison of the flow behavior of (a) the single BCCs (η = 0.03–0.38) and (b) the BCC aggregates (η = 0.2–0.78), at a flow rate of 0.233 μl/min. The purple squares represent the MCF-7 cells, and the orange squares represent the MDA-MB-231 cells. The errors bars denote the standard deviation of the ensemble over which the averaging was performed. The solid line is the analytical solution for Poiseuille flow.

