
Figure 2. While a Significant Increase in the Number of ISCs is Observed in Flies Re-fed for 16 Hours, Symmetric ISC Divisions and Mitoses are Negligible at this Time.
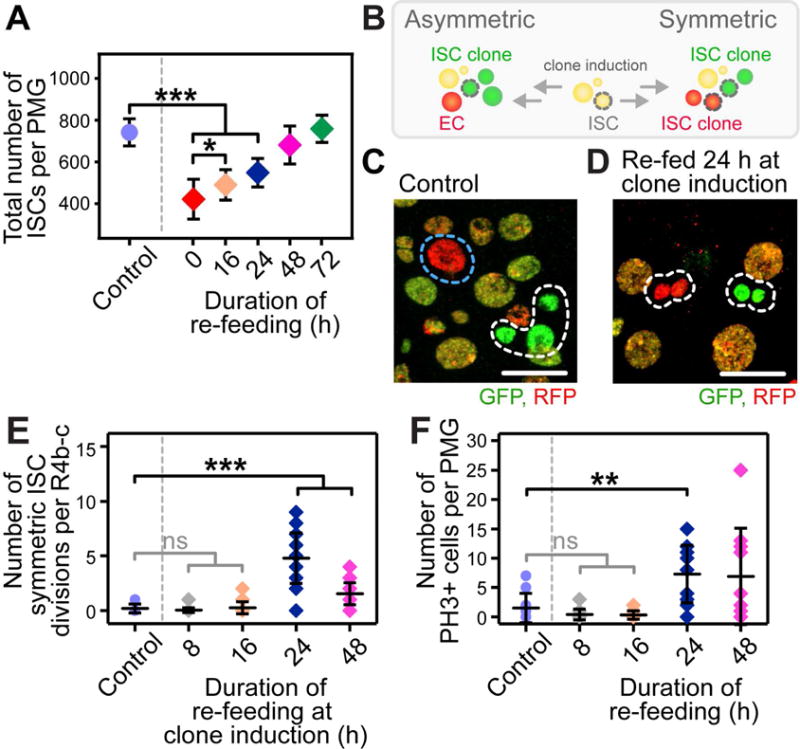
(A) Quantification of the number of ISCs in re-fed flies. n = 10. (*) and (***) denote p < 0.05 and p < 0.001, respectively.
(B) Schematic representation of the twin-spot lineage analysis used to quantify the number of symmetric ISC divisions.
(C–D) Images displaying an asymmetric (C, control) and symmetric (D, re-fed for 24 hours at clone induction) outcome of an ISC division (ISC clone, white dotted outline; transit clone, blue dotted outline). Scale bar = 20 μm.
(E) Quantification of the number of symmetric ISC divisions, defined as two adjacent ISC clones of different color (D), per R4b-c. n = 20. (***) denotes p < 0.001.
(F) Quantification of the number of PH3+ cells per PMG. n = 20. (**) denotes p < 0.01.
(A, F) NRE-lacZ; esg>GFP;
(B–E) y, w, hsFLP; ; FRT2A His-GFP/His2Av-mRFP, FRT2A