
Figure 1.
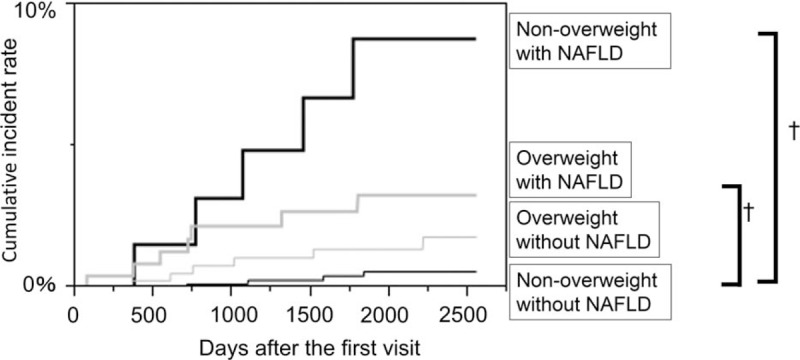
Hazard risk for the incidence cardiovascular diseases. The vertical axis is cumulative incidence of cardiovascular diseases and the horizontal axis is time as days. The black thin line represents nonoverweight without nonalcoholic fatty liver disease (NAFLD). The black bold line represents nonoverweight with NAFLD. The gray thin line represents overweight without NAFLD. The gray bold line represents overweight with NAFLD. The cumulative incidence rate of cardiovascular diseases among groups were evaluated by log-rank test. †P value < .001.