

Abstract
The effect of glycemic control on the prognosis of nondiabetic patients after acute myocardial infarction (AMI) remains uncertain. We investigated whether glycated hemoglobin (HbA1c) is associated with adverse outcomes after AMI in nondiabetic patients. In this observational study, we enrolled nondiabetic patients with AMI in the emergency department of 2 medical centers from January 2011 to September 2014. All patients received primary percutaneous coronary intervention and were divided into 4 groups according to the interquartile range of average HbA1c level (Group I, ≤5.6%; Group II, 5.6%–5.8%; Group III, 5.8%–6.0%; and Group IV, >6.0%). Multivariate logistic analysis was performed to estimate the correlation of HbA1c with major adverse cardiac events (MACEs) after AMI. In total, 267 eligible patients were enrolled; 48 patients (18%) developed MACEs within a median follow-up of 178 days. Univariate analysis showed HbA1c > 6.0%, with a higher risk of MACEs in Group IV than in Group I (odds ratio [OR]: 2.733; 95% confidence interval [CI]: 1.123–6.651 vs OR: 1.511; 95% CI: 0.595–3.835). Multivariate analysis revealed an approximately 3.8 times higher risk of MACEs in Group IV than in Group I (OR: 3.769; 95% CI: 1.30–10.86). The HbA1 level is a significant predictor of MACEs after AMI in nondiabetic patients.
Keywords: acute myocardial infarction, glycated hemoglobin, MACEs, nondiabetic
1. Introduction
Acute myocardial infarction (AMI) is a leading cause of mortality and morbidity worldwide.[1] Since the foundation of clinical guidelines for AMI management,[2] hospitalization and in-hospital mortality rates have significantly declined in recent decades.[3–5] However, the prognosis of patients after AMI requires improvement.
Studies have indicated that the nonfatal AMI population may have a 1.5 to 15 times higher mortality rate than the general population; approximately 10% to 20% of patients experience secondary myocardial infarction (MI) and severe coronary heart disease, and 15% to 20% will experience heart failure (HF) within 5 years of AMI diagnosis.[1,6–9] Comorbidities and severity were significantly higher in recurrent AMI patients than in first MI patients.[10] Moreover, recurrent AMI patients encountered a higher risk of cardiovascular death, cardiogenic shock, and reinfarction but were less likely to receive evidence-based treatment than were first MI patients.[11] Therefore, it is essential to identify AMI patients who have the potential to develop secondary adverse prognosis and to provide prompt preventive intervention to avoid death or severe cardiovascular events.
Several risk prediction tools, such as the thrombolysis in MI (TIMI) risk score,[12] Global Registry of Acute Coronary Events (GRACE) risk score,[13,14] and Acute Physiology and Chronic Health Evaluation II (APACHE II) score, have been widely used and considered as reliable indicators of cardiovascular or all-cause outcomes. However, multiple complicated elements of these tools might affect prediction results, and the validity periods of the predictions are short.
Glycated hemoglobin (HbA1c) is formed by a series of chemical reactions between Hb and blood glucose. It represents the average blood glucose over 2 to 3 months, facilitates assessing the long-term glycemic control status in patients with diabetes, and can be determined by a simple blood examination. The type 2 diabetes mellitus (DM) population has a higher risk of cardiovascular disease (CVD) and shows poorer outcomes than does the general population.[15–17] Possible reasons may be endothelial and coagulation system dysfunction and inflammation exacerbation promoted by poor glycemic control.[18–20] Although the correlation of long-term glycemic control with coronary artery disease prognosis has been extensively studied,[21–24] few studies have focused on nondiabetic patients, and the results of analogous research remain unclear and controversial.[25–29]
Considering the limited information on and uncertain effects of long-term glycemic control on prognosis after AMI, we sought to determine whether HbA1c is associated with the outcomes after nonfatal MI and whether it can be an effective prognostic indicator and thereby provide a precise clinical guideline for identifying patients requiring early intervention.
2. Material and methods
2.1. Study design
In this retrospective observational study, we enrolled patients from the emergency department of 2 large medical centers, Taipei Veterans General Hospital and Taipei Municipal Wanfang Hospital; the annual average number of patients in the emergency departments of these hospitals is 85,000 and 66,000, respectively. We included nondiabetic patients hospitalized because of non-ST elevation MI (NSTEMI) or ST-segment elevation MI (STEMI) who received primary percutaneous coronary intervention (PCI) between January 2011 and September 2014.
2.2. Data collection
Specially trained nurses and a medical record technologist abstracted detailed information from the medical records of each enrolled patient. All the demographic and clinical data, namely, baseline characteristics (age, sex, and body mass index [BMI]), medical history (underlying comorbidities, risk factors for CVD, PCI process record, in-hospital medicine use, and risk assessment score), and laboratory tests (renal function, lipid profile, cardiac enzyme, HbA1c, and admission glucose) were collected from the medical records. All the patients were followed for 1 year from the AMI index date. Data were collected on the HbA1c level measured during the follow-up period and first major adverse cardiac events (MACEs) after nonfatal MI. HbA1c level was calculated and presented as a mean if it was measured more than once during the follow-up period. The periodic meetings would be held with the chart abstractors and all the study members to ensure the accuracy of the research process. In this study, HbA1c was measured an average of 1.4 times for each patient. The whole blood samples of each patient from peripheral venous vessels were collected into a sterile tube containing ethylenediaminetetraacetic acid.[30] HbA1c analyses were performed using Tosoh Automated Glycohemoglobin Analyzer HLC-723G8 (Tosoh Corporation, Tokyo, Japan) and the Capillarys 2 Flex Piercing analyzer (Sebia, Lisses, France) in Taipei Veterans General Hospital and Taipei Municipal Wanfang Hospital, respectively. These instruments are certified by the National Glycohemoglobin Standardization Program and standardized to the Diabetes Control and Complications Trial reference assay.[31] This study was approved by the institutional review boards of Taipei Medical University and Taipei Veterans General Hospital. All the data were obtained from the application of 2 centers after the approval of the both institutional review boards. In addition, the process of data collecting and analyzing was monitored by the institutional review boards periodically.
2.3. Definitions
Nondiabetic patients were defined as those without a history of diabetes at admission, who never received antidiabetic treatment, and with HbA1c < 6.5%.[31] STEMI was defined as a new ST-segment–T wave changes of >2 mm in 2 or more V1 to V3 leads or of >1 mm in 2 or more limb leads, a new presumed left bundle branch block on 12-lead electrocardiography (ECG), an increase in at least 1 cardiac biomarker (creatine kinase [CK], creatine kinase-MB fraction, and troponin I). NSTEMI was defined as patients with typical chest pain with cardiac enzyme elevation and no ST-segment elevation on ECG.[32] Furthermore, we recorded intra-aortic balloon pump use and coronary artery bypass grafting (CABG) of the patients during hospitalization for nonfatal AMI. MACEs were defined as all-cause mortality, repeated PCI, (such as target vessel revascularization, the progression of stenosis that needs PCI intervention or CABG), recurrent AMI (the second-time AMI occurrence that needed Percutaneous Transluminal Coronary Angioplasty intervention within a year from the AMI index date), and HF requiring hospitalization (patients hospitalized with the major diagnosis of acute HF after the first-time AMI).
2.4. Inclusion criteria
We enrolled nondiabetic patients who regularly underwent conventional examination in outpatient clinics for at least 1 year. The patients who underwent HbA1c measurement at least once during the follow-up period were enrolled. All the patients had received PCI and complete post-AMI treatment during hospitalization.
2.5. Exclusion criteria
Patients with in- and out-of-hospital cardiac arrest or refused PCI were considered to have predictable poor prognosis and were therefore excluded. To avoid including undiagnosed or potentially diabetic patients in the study population, patients with newly diagnosed DM within 1 year of follow-up were also excluded.
2.6. Statistical analysis
The statistical methods used to determine the size of the sample is 2 independent t tests with the setting parameters as follows—effect size: 0.5, power: 0.8, and ratio of MACEs/without MACEs: 0.25. The predicted number of patients without MACEs is 160, and predicted number of patients with MACEs is 40. Continuous variables are expressed as mean and standard deviation. Categorical variables are expressed as frequency and percentage. The normality of variables was analyzed using the Kolmogorov–Smirnov test. Chi-squared or Fisher exact tests were used to compare categorical variables. Independent samples t tests and one-way analysis of variance were used to compare normally distributed continuous variables. The Mann–Whitney U and Kruskal–Wallis tests were used to compare nonnormally distributed continuous variables. Multivariate logistic regression analysis was performed to assess the correlation of HbA1c categories with MACEs. The receiver operating characteristic (ROC) curve was plotted to determine the cutoff value of HbA1c, and the area under curve (AUC) was calculated to analyze the predictive accuracy of HbA1c for MACEs. All the values were 2-tailed, and P < .05 was considered statistically significant in all the analyses. All the statistical analyses were conducted using the IBM SPSS program (Version 22.0; SPSS, Chicago, IL).
3. Results
3.1. Patient baseline demographic and characteristics
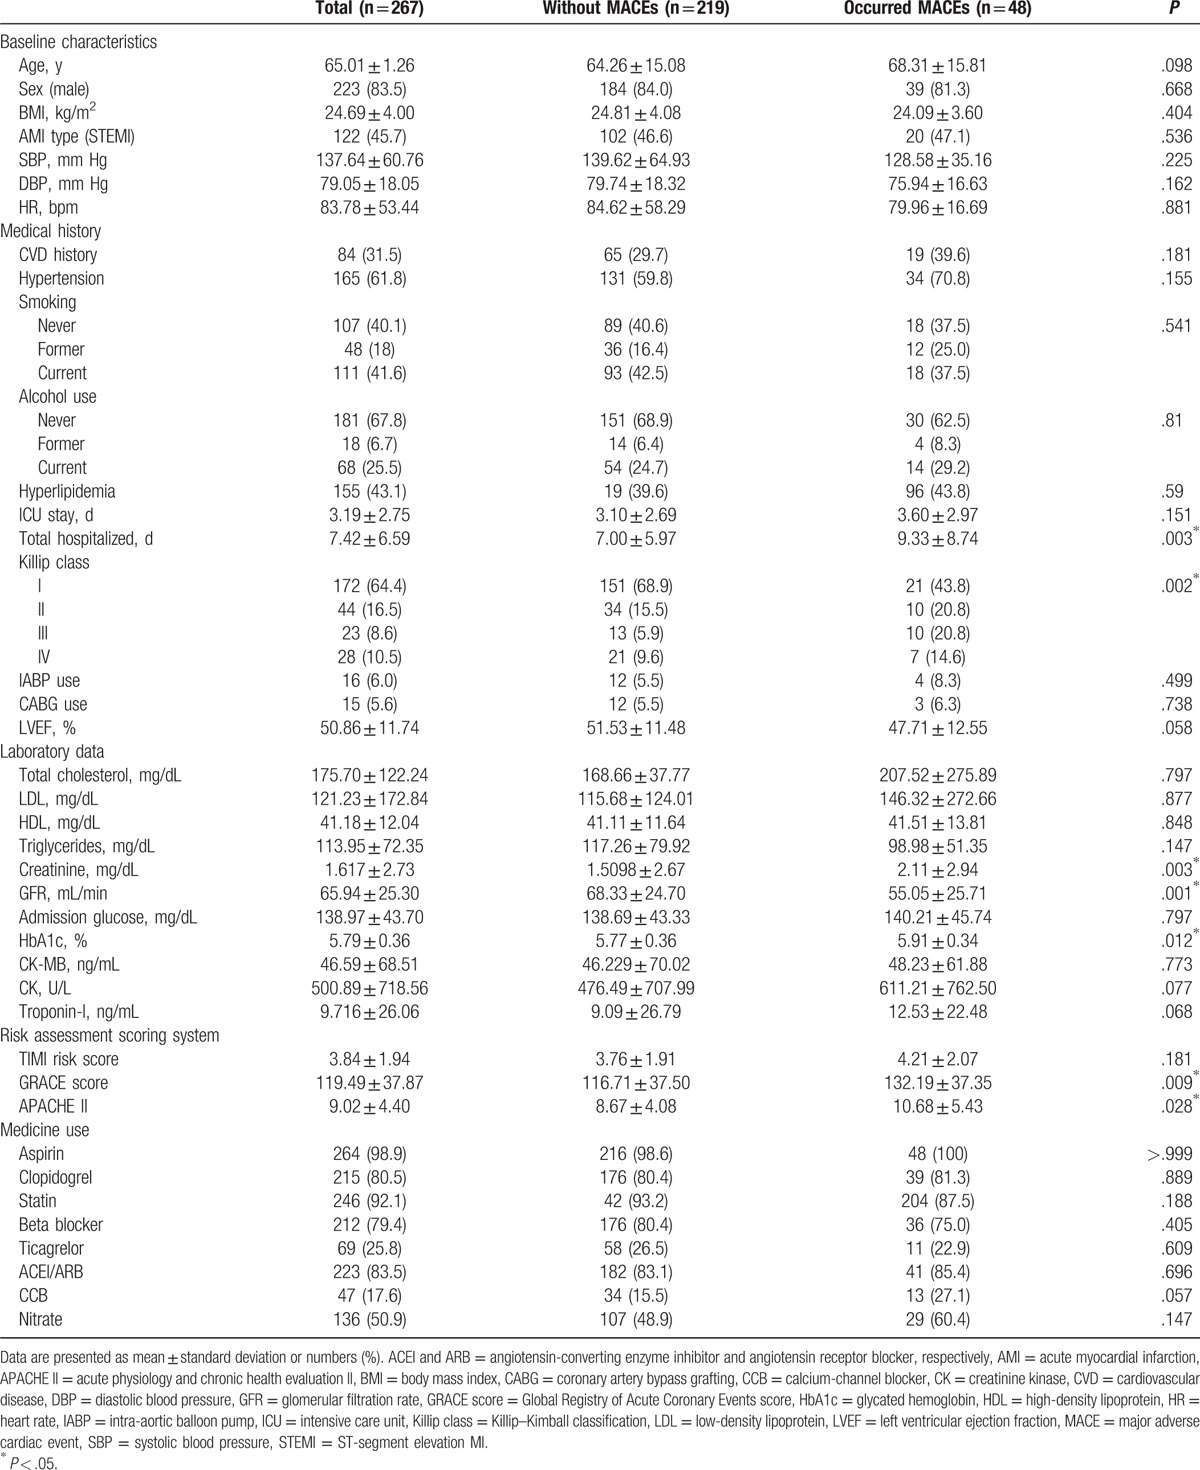
We enrolled 341 patients in our study, and 74 were excluded because of newly diagnosed DM in the following year (n = 42), in- and out-of-hospital cardiac arrest (n = 24), and refusal to receive PCI (n = 8). The median number of days for MACEs was 178. Overall, we analyzed 267 patients (Fig. 1). Table 1 compares the baseline characteristics of patients with (n = 48, 18%) and without (n = 219, 82%) MACEs. The mean age of the patients was 65 ± 1.26 (30–97) years, and 223 (83.5%) patients were males. The average BMI of the patients was 24.69 ± 4.0 kg/m2. A total of 122 (45.7%) patients experienced STEMI and 145 (54.3%) experienced NSTEMI. History (CVD history, hypertension, and hyperlipidemia), hemodynamics (systolic blood pressure, diastolic blood pressure, and heart rate), smoking, alcohol consumption, lipid profile, cardiac enzyme, and medical use did not differ significantly between the 2 groups. The GRACE risk, APACHE II scores, and Killip class III were significantly higher in the patients with MACEs. In addition, these patients were more likely to have more hospitalized days during nonfatal AMI treatment and higher creatinine levels and glomerular filtration rates (GFRs). The mean HbA1c value of the patients with MACEs was significantly higher than that of the patients without MACEs (5.91% ± 0.34% vs 5.77% ± 0.36%; P = .012; Table 1).
Figure 1.
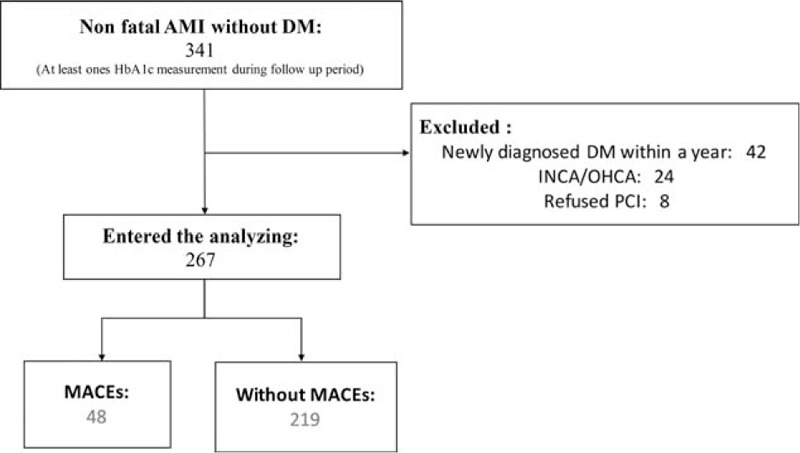
Flowchart of patient enrollment. AMI = acute myocardial infarction, DM = diabetes mellitus, HbA1c = glycated hemoglobin, INCA and OHCA = in- and out-of-hospital cardiac arrest, respectively, MACE = major adverse cardiac event, PCI = primary percutaneous coronary intervention.
Table 1.
Comparison of the baseline characteristics of patients with and without MACEs.
3.2. Glycated hemoglobin predicts major adverse cardiac events
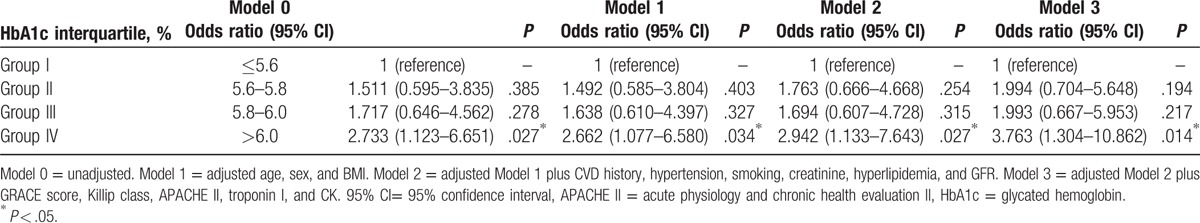
We divided the patients into 4 groups according to HbA1c interquartile range (Group I, ≤5.6%; Group II, 5.6%–5.8%; Group III, 5.8%–6.0%; and Group IV, >6.0%); these groups included 77 (28.8%), 72 (27.0%), 54 (20.2%), and 64 (24.0%) patients, respectively. The distribution of the MACE occurrence rate in each group is shown in Fig. 2. MACE occurrence increased with HbA1c level, exhibiting a significant positive correlation (chi-squared test for trend, P = .024; Fig. 2). Univariate logistic analysis revealed creatinine, GFR, HbA1c > 6.0%, and GRACE, APACHE II scores, and Killip class III as significant predictors. Multivariate analysis revealed that BMI (odds ratio [OR]: 0.883, 95% confidence interval [CI]: 0.791–0.987, P = .028), HbA1c > 6.0% (OR: 3.763, 95% CI: 1.304–10.862, P = .014), and Killip class III score (OR: 4.676, 95% CI: 1.254–17.439, P = .022) were independent predictors of MACEs (Table 2). Regarding the predictive ability of HbA1c in different models, the results of logistic regression analysis adjusted for distinct variables in the 4 models are presented in Table 3. HbA1c > 6.0% showed significant predictive efficacy in all models, with model 3 exhibiting the highest significance. The risk of MACEs considering HbA1c > 6.0% was approximately 3.8 times higher than that considering HbA1c ≤ 5.6% after adjustment for age, sex, BMI, CVD history, hypertension, smoking, creatinine, hyperlipidemia, GFR, CK, troponin I, and GRACE, Killip class III, APACHE II scores (OR: 3.763, 95% CI: 1.304–10.862, P = .014; Table 3).
Figure 2.
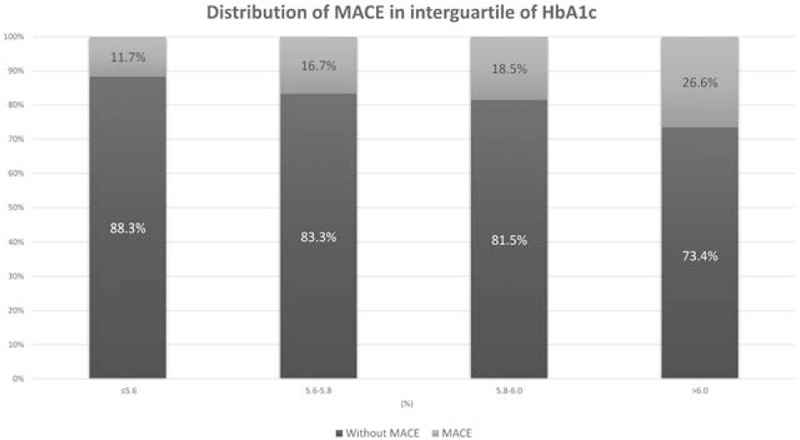
Distribution of major adverse cardiac events among each glycated hemoglobin category. Chi-squared test for trend, P = .024. HbA1c = glycated hemoglobin, MACE = major adverse cardiac event.
Table 2.
Logistic regression analysis of predictors of MACEs.
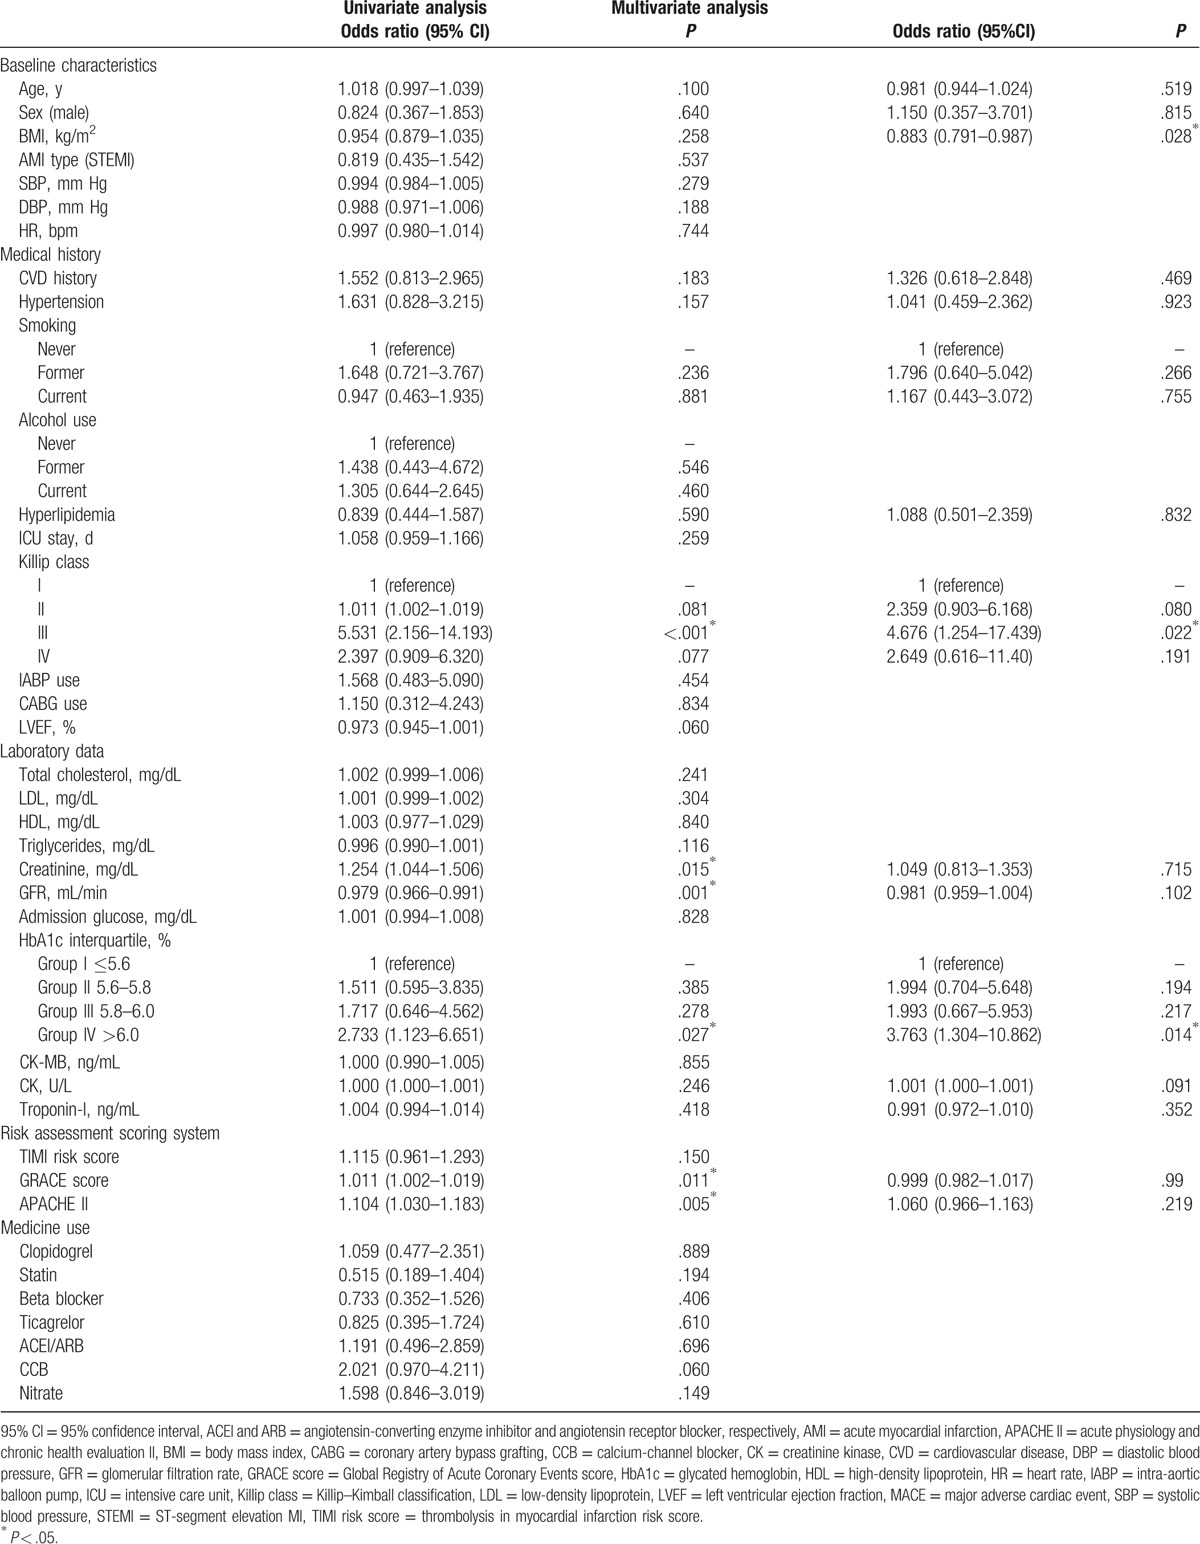
Table 3.
Odds ratios of MACEs among HbA1c interquartile range with adjustment of different variables.
3.3. Receiver operating characteristic curve with the cutoff value of HbA1c for detecting major adverse cardiac events
We plotted the ROC curve with a cutoff value of HbA1c for predicting MACEs after AMI. The AUC was 0.615 (95% CI: 0.529–0.701, P = .013). The cutoff value of HbA1c was 5.78%; the corresponding sensitivity and specificity were 0.729 and 0.452, respectively (Fig. 3).
Figure 3.
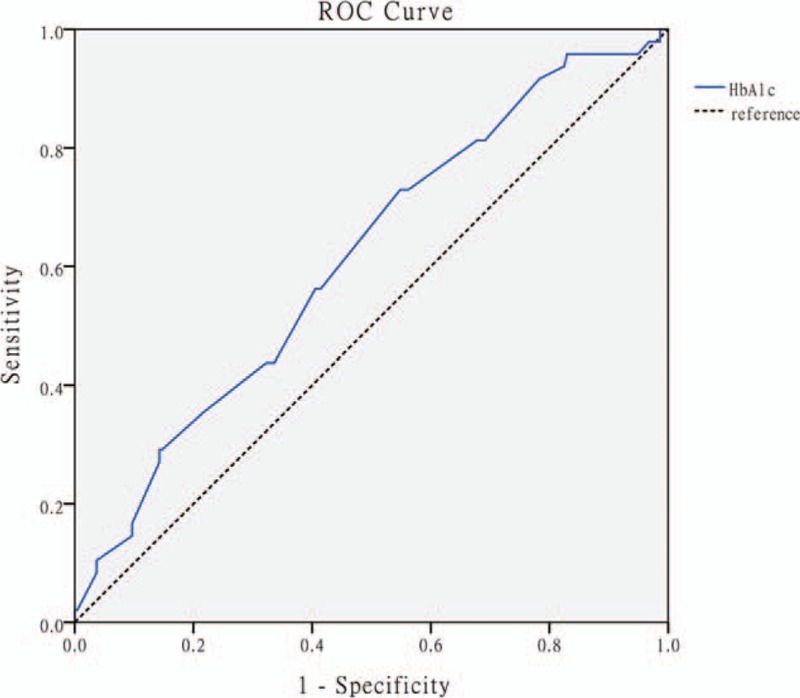
Receiver operating characteristic curve with the cutoff value of glycated hemoglobin for detecting major adverse cardiac events. Area under curve: 0.616, 95% confidence interval: 0.529 to 0.701; cutoff value: 5.78; P = .013 (sensitivity: 0.729 and specificity: 0.452).
4. Discussion
In the present study, the HbA1c value and MACEs after AMI were significantly associated in nondiabetic patients. Our findings reveal that Groups II and III were not significantly correlated with the risk of MACEs compared with Group I. However, Group IV was at a significantly higher risk of MACEs than Group I, and the cutoff value obtained from the ROC curve was 5.78%. This value is within the normal range for diabetes detection. Thus, this value is easily neglected during the post-AMI follow-up, particularly in nondiabetic patients who are considered a comparatively healthy population. Hence, this cutoff value may serve as an indicator of clinical reference for secondary prevention for improving the prognosis after AMI.
When considering other risk assessment scoring systems that have frequently been used in clinical studies, HbA1c is a more favorable predictor than TIMI, GRACE risk, and APACHE II scores. GRACE and APACHE II scores appear to be effective predictive tools in univariate analysis, whereas only HbA1c showed statistical significance in multivariate analysis. Therefore, we consider HbA1c to be a more efficient indicator of 1 year outcomes for AMI, which is more stable and easily obtained.
The glycemic control status is significantly correlated to the prognosis of AMI in the nondiabetic population, which may be attributed to the damage of vascular structures caused by poor glycemic status, which may occur before DM onset. The mechanisms might include severe coronary endothelial dysfunction because of increased oxidative stress caused by high glucose,[18,33] increased platelet adhesion that promotes venous thrombosis,[19,34] and enhanced inflammatory responses, which cause the progression of atherosclerosis or vascular injury.[20,35,36] Furthermore, poor glycemic control may lead to an increased conformation of advanced glycation end products, which may cause severe vascular damage.[18] Therefore, HbA1c, which reflects metabolic control and embedded ongoing vascular injury or atherosclerosis, may be considered a reliable indicator of adverse outcomes in nondiabetic populations after AMI.
Our study showed that only HbA1c but not glucose was associated with MACEs. These results have notable interpretations. First, the effect on an unequal diet condition when patients admitted to an emergency room and acute stress because of severe diseases may contribute to inaccurate glucose values. Comparatively, HbA1c is a steady biomarker that is less likely to be disrupted and may be considered a more efficient clinical indicator. Second, the influence of elevated blood glucose on the prognosis of AMI may be classified into different mechanisms and represent distinct significance compared with HbA1c. Several studies have reported that elevated glucose more strongly represents the acute phase of diseases, whereas HbA1c represents long-term metabolic disorders. Timmer et al reported that in patients without diabetes, admission glucose levels are more associated with acute and short-term prognosis of AMI, such as infarct size of the myocardium and 30-day mortality, compared with HbA1c. In long-term mortality (approximately 3-year follow-up), only HbA1c was correlated.[37] Liu et al[38] revealed that glucose is a significant predictor of 7- and 30-day mortality, rather than HbA1c. Selvin et al[39] conducted a median 14-year follow-up study and indicated that the HbA1c value is associated with the risk of DM and more closely with risks of CVD and death compared with fasting glucose in the nondiabetic population.
The American Diabetes Association (ADA) indicated that patients with HbA1c of 5.7% to 6.4% might have a prediabetic status and an increased risk of diabetes and cardiovascular mortality.[31,40] HbA1c of 6.0% to 6.5% confers a 25% to 50% 5-year risk of diabetes.[41] To avoid the effect of enrolling unrecognized DM or prediabetic patients on our study results (we reported newly diagnosed DM in 12% of the patients within 1 year after AMI), we included patients who fit the ADA definition of nondiabetes and excluded those who were newly diagnosed with diabetes within 1 year of follow-up.[31] Therefore, our study results may more strongly represent responses presented by the nondiabetic population.
Our study has several limitations. First, this was a retrospective observational study, which may have caused inevitable selection bias. Second, because of the rigorous population screening process, the study sample size was relatively small despite including 2 large medical centers. Third, the follow-up period of the patients was only 1 year; thus, it is necessary to investigate the longer term relationship between HbA1c and MACEs in the nondiabetic population. Fourth, the time and frequency of conducting HbA1c examination for the patients during the study were inconsistent[42,43]; therefore, a randomized clinical study with a fixed frequency and time of HbA1c examination is required in the future.
5. Conclusion
Our study showed that HbA1c is a significant predictor of MACEs after AMI in nondiabetic patients. This biomarker may strengthen the accuracy of clinical care in early intervention and secondary prevention. HbA1c may be considered an effective indicator that facilitates the early detection of patients with potential adverse prognosis after nonfatal MI.
Footnotes
Abbreviations: ADA = American Diabetes Association, AMI = acute myocardial infarction, AUC = area under curve, BMI = body mass index, CABG = coronary artery bypass grafting, CI = 95% confidence interval, CK = creatine kinase, CVD = cardiovascular disease, DM = diabetes mellitus, ECG = electrocardiography, GFR = glomerular filtration rate, GRACE = Global Registry of Acute Coronary Events, HbA1c = glycated hemoglobin, HF = heart failure, MACE = major adverse cardiac event, MI = myocardial infarction, NSTEMI = non-ST elevation MI, OR = odds ratio, PCI = percutaneous coronary intervention, ROC = receiver operating characteristic, STEMI = ST-segment elevation MI, TIMI = thrombolysis in MI.
Author contributions: C-LC conceived the study, drafted the manuscript, and collected the data. DH-TY supervised the conduct of the study, conceived, and designed the study strategies. WH-HS, C-SL, S-HT, and S-JC contributed to the design of the study and contributed to the data collection. C-WH supervised the study procedure, obtained funding, and provided statistical advice on study design, and all authors contributed substantially to its revision. C-WH takes responsibility for the paper as a whole.
Funding/support: C-WH was supported by Wan Fang Hospital, Taipei Medical University (105-wf-eva-11). The authors appreciate the statistical consultation of Hsin-Yi Huang of the Biostatistics Task Force, Taipei Veterans General Hospital.
The authors have no conflicts of interest to disclose.
References
- [1].Mozaffarian D, Benjamin EJ, Go AS, et al. Heart disease and stroke statistics—2015 update: a report from the American Heart Association. Circulation 2015;131:e29–322. [DOI] [PubMed] [Google Scholar]
- [2].Gunnar RM, Bourdillon PD, Dixon DW, et al. ACC/AHA guidelines for the early management of patients with acute myocardial infarction. A report of the American College of Cardiology/American Heart Association Task Force on Assessment of Diagnostic and Therapeutic Cardiovascular Procedures (subcommittee to develop guidelines for the early management of patients with acute myocardial infarction). Circulation 1990;82:664–707. [DOI] [PubMed] [Google Scholar]
- [3].Yin WH, Lu TH, Chen KC, et al. The temporal trends of incidence, treatment, and in-hospital mortality of acute myocardial infarction over 15 years in a Taiwanese population. Int J Cardiol 2016;209:103–13. [DOI] [PubMed] [Google Scholar]
- [4].Chen J, Normand SL, Wang Y, et al. Recent declines in hospitalizations for acute myocardial infarction for Medicare fee-for-service beneficiaries: progress and continuing challenges. Circulation 2010;121:1322–8. [DOI] [PubMed] [Google Scholar]
- [5].Bajaj A, Sethi A, Rathor P, et al. Acute complications of myocardial infarction in the current era: diagnosis and management. J Investig Med 2015;63:844–55. [DOI] [PubMed] [Google Scholar]
- [6].Brown TM, Deng L, Becker DJ, et al. Trends in mortality and recurrent coronary heart disease events after an acute myocardial infarction among Medicare beneficiaries, 2001–2009. Am Heart J 2015;170:249–55. [DOI] [PubMed] [Google Scholar]
- [7].Chen SY, Crivera C, Stokes M, et al. Clinical and economic outcomes among hospitalized patients with acute coronary syndrome: an analysis of a national representative Medicare population. Clinicoecon Outcomes Res 2013;5:181–8. [DOI] [PMC free article] [PubMed] [Google Scholar]
- [8].Smolina K, Wright FL, Rayner M, et al. Long-term survival and recurrence after acute myocardial infarction in England 2004 to 2010. Circ Cardiovasc Qual Outcomes 2012;5:532–40. [DOI] [PubMed] [Google Scholar]
- [9].Menzin J, Wygant G, Hauch O, et al. One-year costs of ischemic heart disease among patients with acute coronary syndromes: findings from a multi-employer claims database. Curr Med Res Opin 2008;24:461–8. [DOI] [PubMed] [Google Scholar]
- [10].Shotan A, Blondheim DS, Gottlieb S, et al. Comparison of outcome of recurrent versus first ST-segment elevation myocardial infarction (from national Israel surveys 1998 to 2006). Am J Cardiol 2011;107:1730–7. [DOI] [PubMed] [Google Scholar]
- [11].Radovanovic D, Maurer L, Bertel O, et al. Treatment and outcomes of patients with recurrent myocardial infarction: a prospective observational cohort study. J Cardiol 2016;68:498–503. [DOI] [PubMed] [Google Scholar]
- [12].Karounos M, Chang AM, Robey JL, et al. TIMI risk score: does it work equally well in both males and females? Emerg Med J 2007;24:471–4. [DOI] [PMC free article] [PubMed] [Google Scholar]
- [13].Aragam KG, Tamhane UU, Kline-Rogers E, et al. Does simplicity compromise accuracy in ACS risk prediction? A retrospective analysis of the TIMI and GRACE risk scores. PLoS One 2009;4:e7947. [DOI] [PMC free article] [PubMed] [Google Scholar]
- [14].Fox KA, Dabbous OH, Goldberg RJ, et al. Prediction of risk of death and myocardial infarction in the six months after presentation with acute coronary syndrome: prospective multinational observational study (GRACE). BMJ 2006;333:1091. [DOI] [PMC free article] [PubMed] [Google Scholar]
- [15].Moss SE, Klein R, Klein BE. Cause-specific mortality in a population-based study of diabetes. Am J Public Health 1991;81:1158–62. [DOI] [PMC free article] [PubMed] [Google Scholar]
- [16].Rousan TA, Pappy RM, Chen AY, et al. Impact of diabetes mellitus on clinical characteristics, management, and in-hospital outcomes in patients with acute myocardial infarction (from the NCDR). Am J Cardiol 2014;114:1136–44. [DOI] [PubMed] [Google Scholar]
- [17].Timmer JR, Ottervanger JP, de Boer MJ, et al. Primary percutaneous coronary intervention compared with fibrinolysis for myocardial infarction in diabetes mellitus: results from the Primary Coronary Angioplasty vs Thrombolysis-2 trial. Arch Intern Med 2007;167:1353–9. [DOI] [PubMed] [Google Scholar]
- [18].Woodman RJ, Chew GT, Watts GF. Mechanisms, significance and treatment of vascular dysfunction in type 2 diabetes mellitus. Drugs 2005;65:31–74. [DOI] [PubMed] [Google Scholar]
- [19].Ferreiro GF, Angiolillo DJ. Diabetes and antiplatelet therapy in acute coronary syndrome. Circulation 2011;123:798–813. [DOI] [PubMed] [Google Scholar]
- [20].Pickup JC, Mattock MB, Chusney GD, et al. NIDDM as a disease of the innate immune system: association of acute-phase reactants and interleukin-6 with metabolic syndrome X. Diabetologia 1997;40:1286–92. [DOI] [PubMed] [Google Scholar]
- [21].Salmasi AM, Frost P, Dancy M. Is glycated haemoglobin a sensitive index to identify left ventricular dysfunction two months after acute myocardial infarction in normotensive subjects? Int J Cardiol 2006;110:67–73. [DOI] [PubMed] [Google Scholar]
- [22].Syed IA, Khan WA. Glycated haemoglobin a marker and predictor of cardiovascular disease. J Pak Med Assoc 2011;61:690–5. [PubMed] [Google Scholar]
- [23].El-Sherbiny I, Nabil B, Saber T, et al. Impact of admission glycosylated hemoglobin A1c on angiographic characteristics and short term clinical outcomes of nondiabetic patients with acute ST-segment elevation myocardial infarction. Cardiol Res Pract 2015;2015:274892. [DOI] [PMC free article] [PubMed] [Google Scholar]
- [24].Khaw KT, Wareham N, Luben R, et al. Glycated haemoglobin, diabetes, and mortality in men in Norfolk cohort of European prospective investigation of cancer and nutrition (EPIC-Norfolk). BMJ 2001;322:15–8. [DOI] [PMC free article] [PubMed] [Google Scholar]
- [25].Carson AP, Fox CS, McGuire DK, et al. Low hemoglobin A1c and risk of all-cause mortality among US adults without diabetes. Circ Cardiovasc Qual Outcomes 2010;3:661–7. [DOI] [PMC free article] [PubMed] [Google Scholar]
- [26].Tian L, Zhu J, Liu L, et al. Hemoglobin A1c and short-term outcomes in patients with acute myocardial infarction undergoing primary angioplasty: an observational multicenter study. Coron Artery Dis 2013;24:16–22. [DOI] [PubMed] [Google Scholar]
- [27].Su G, Mi SH, Li Z, et al. Prognostic value of early in-hospital glycemic excursion in elderly patients with acute myocardial infarction. Cardiovasc Diabetol 2013;12:33. [DOI] [PMC free article] [PubMed] [Google Scholar]
- [28].Verdoia M, Schaffer A, Barbieri L, et al. Glycosylated hemoglobin and the risk of periprocedural myocardial infarction in non-diabetic patients. J Diabetes Complications 2015;29:517–22. [DOI] [PubMed] [Google Scholar]
- [29].Brewer N, Wright CS, Travier N, et al. A New Zealand linkage study examining the associations between A1C concentration and mortality. Diabetes Care 2008;31:1144–9. [DOI] [PubMed] [Google Scholar]
- [30].Liu O, Li JR, Gong M, et al. Genetic analysis of six SNPs in candidate genes associated with high cross-race risk of development of thoracic aortic aneurysms and dissections in Chinese Han population. Acta Pharmacol Sin 2010;31:1376–80. [DOI] [PMC free article] [PubMed] [Google Scholar]
- [31].American Diabetes Association. Classification and diagnosis of diabetes. Diabetes Care 2016;39(suppl 1):S13–22. [DOI] [PubMed] [Google Scholar]
- [32].Thygesen K, Alpert JS, Jaffe AS, et al. Third universal definition of myocardial infarction. J Am Coll Cardiol 2012;60:1581–98. [DOI] [PubMed] [Google Scholar]
- [33].Dhar I, Dhar A, Wu L, et al. Arginine attenuates methylglyoxal- and high glucose-induced endothelial dysfunction and oxidative stress by an endothelial nitric-oxide synthase-independent mechanism. J Pharmacol Exp Ther 2012;342:196–204. [DOI] [PubMed] [Google Scholar]
- [34].Lemkes BA, Hermanides J, Devries JH, et al. Hyperglycemia: a prothrombotic factor? J Thromb Haemost 2010;8:1663–9. [DOI] [PubMed] [Google Scholar]
- [35].Fukuhara M, Matsumura K, Wakisaka M, et al. Hyperglycemia promotes microinflammation as evaluated by C-reactive protein in the very elderly. Intern Med 2007;46:207–12. [DOI] [PubMed] [Google Scholar]
- [36].Buraczynska M, Zukowski P, Drop B, et al. Effect of G(-174)C polymorphism in interleukin-6 gene on cardiovascular disease in type 2 diabetes patients. Cytokine 2016;79:7–11. [DOI] [PubMed] [Google Scholar]
- [37].Timmer JR, Hoekstra M, Nijsten MW, et al. Prognostic value of admission glycosylated hemoglobin and glucose in nondiabetic patients with ST-segment-elevation myocardial infarction treated with percutaneous coronary intervention. Circulation 2011;124:704–11. [DOI] [PubMed] [Google Scholar]
- [38].Liu Y, Yang YM, Zhu J, et al. Haemoglobin A(1c), acute hyperglycaemia and short-term prognosis in patients without diabetes following acute ST-segment elevation myocardial infarction. Diabet Med 2012;29:1493–500. [DOI] [PubMed] [Google Scholar]
- [39].Selvin E, Steffes MW, Zhu H, et al. Glycated hemoglobin, diabetes, and cardiovascular risk in nondiabetic adults. N Engl J Med 2010;362:800–11. [DOI] [PMC free article] [PubMed] [Google Scholar]
- [40].DECODE Study Group. Glucose tolerance and cardiovascular mortality. Arch Intern Med 2001;161:397. [DOI] [PubMed] [Google Scholar]
- [41].Zhang X, Gregg EW, Williamson DF, et al. A1C level and future risk of diabetes: a systematic review. Diabetes Care 2010;33:1665–73. [DOI] [PMC free article] [PubMed] [Google Scholar]
- [42].Lee EJ, Kim YJ, Kim TN, et al. A1c variability can predict coronary artery disease in patients with type 2 diabetes with mean a1c levels greater than 7. Endocrinol Metabol 2013;28:125–32. [DOI] [PMC free article] [PubMed] [Google Scholar]
- [43].Ma WY, Li HY, Pei D, et al. Variability in hemoglobin A1c predicts all-cause mortality in patients with type 2 diabetes. J Diabetes Complications 2012;26:296–300. [DOI] [PubMed] [Google Scholar]