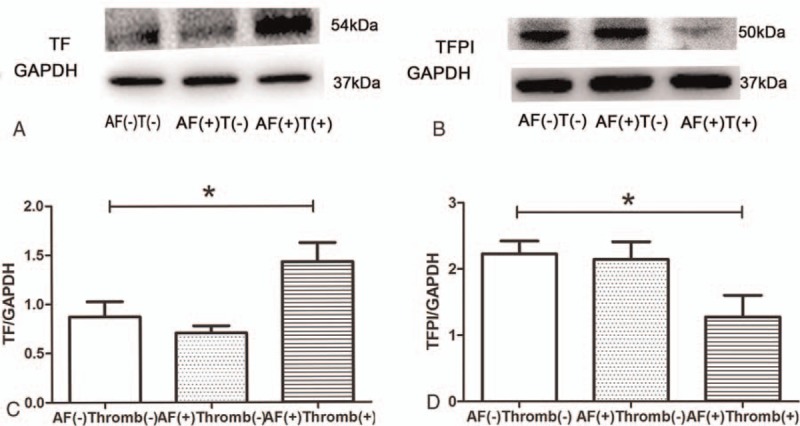
Figure 3.

Western blot analysis of TF and TFPI. (A) Result of TF for 3 groups. (B) Image of TFPI. (C) Increased quantity of TF in AF with thrombus group, ∗P = .009. (D) TFPIs were decreased in AF with thrombus group, ∗P = .04. AF = atrial fibrillation, T = thrombus, TF = tissue factor, TFPIs = tissue factor pathway inhibitors.
