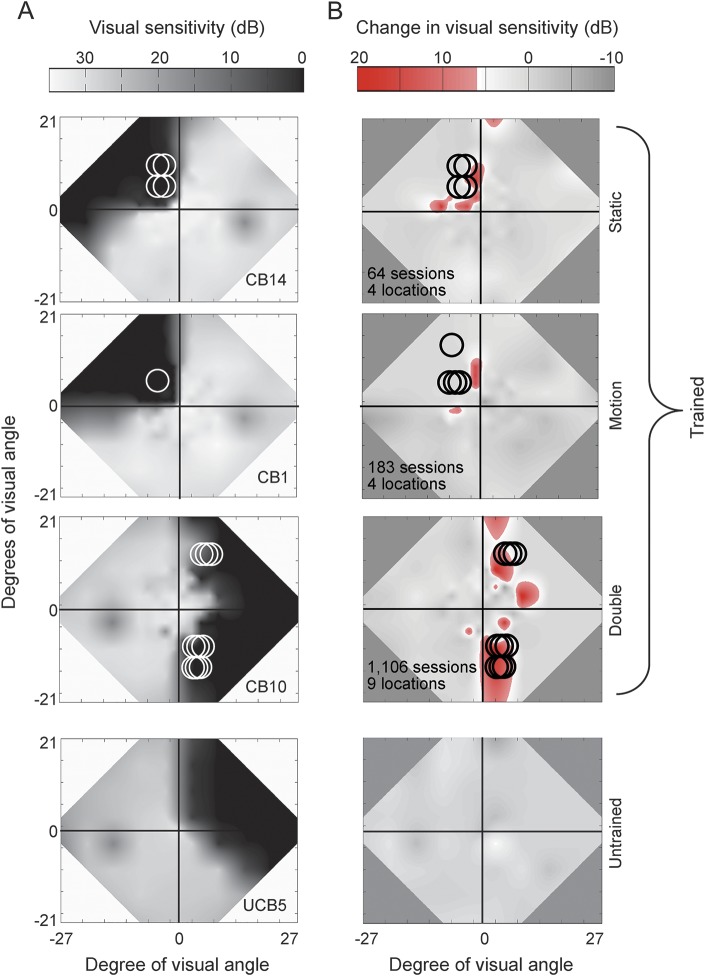
Figure 2. Effect of visual discrimination training on Humphrey visual fields (HVFs).
(A) Composite HVFs with circles indicating the size and location of training stimuli. (B) Difference HVF maps on the same patients as in A with red hues indicating locations of significant improvement in luminance sensitivity (i.e., ≥6 dB of improvement). Number of training sessions and number of locations trained are listed for each trained patient. Details of how the maps were created are provided in appendix e-1.

