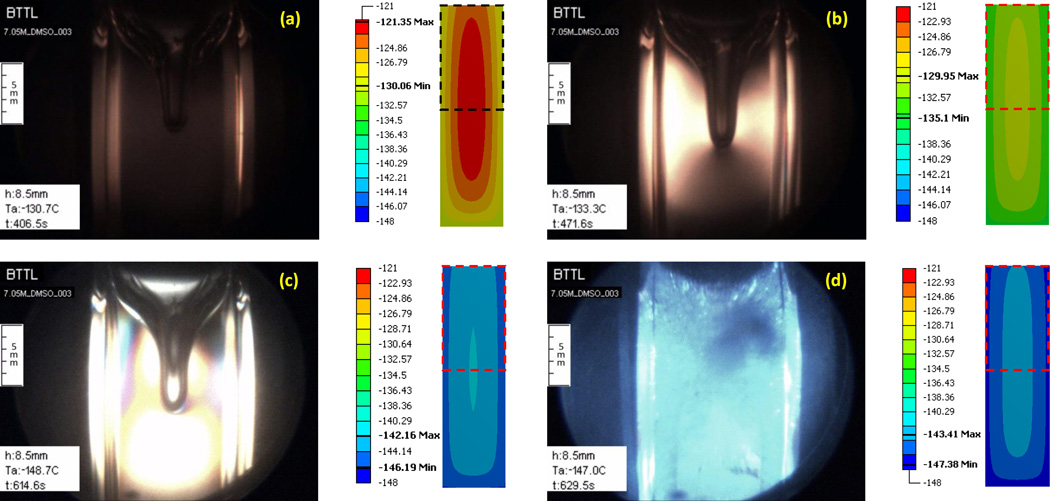
Figure 7.
Experimental results demonstrating the formation of a large cavity in 7.05M DMSO and polarized light effects for the thermal protocol displayed in Fig. 8. Simulation results for the temperature field at corresponding point in time are displayed to the right of each image, where the dashed-squared contour represents the frame of view by the cryomacroscope, the temperature scale is presented in Celsius degrees, and the maximum (Max) and minimum (Min) temperature observed in the field of view are highlighted in the scale. Events: (a) stress starts to form near walls where the material approaches the glass transition; (b) stress is evident across the domain with the higher intensity between the wall and cavity; (c) a display of more than one polarized light spectrum, while brightness increases to the point of saturation of the CCD sensors at the center of the image; (d) intense fracturing in the domain visualized with visible light.

