
Fig. 4.
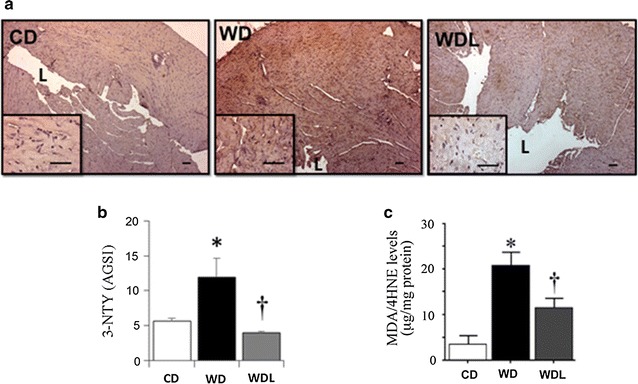
Linagliptin abrogates WD-induced oxidative stress. a Representative micrographs show myocardial 3-nitrotyrosine immunostaining at low (4×) and high (40×) magnification (inset). L indicates lumen of the left ventricle. b Bar graph shows semi-quantitative analysis of 3-nitrotyrosine staining expressed as average gray scale intensities (AGSI). c Bar graph shows myocardial levels of malondialdehyde MDA and its degradation product, 4-hydroxynonenal (4HNE). *p < 0.05 vs CD and †p < 0.05 vs WD. N = 3–6/group