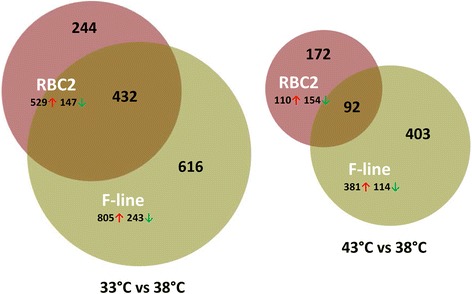
Fig. 3.

Distribution of differentially expressed genes during proliferation of cultured turkey p. major satellite cells. For each temperature comparison, the number of genes with FDR pval <0.05 and |Log2FC| > 2.0 that were shared or unique to each line (RBC2 and F) are indicated in the Venn diagram [71]. Circle size is proportional to the number of genes
