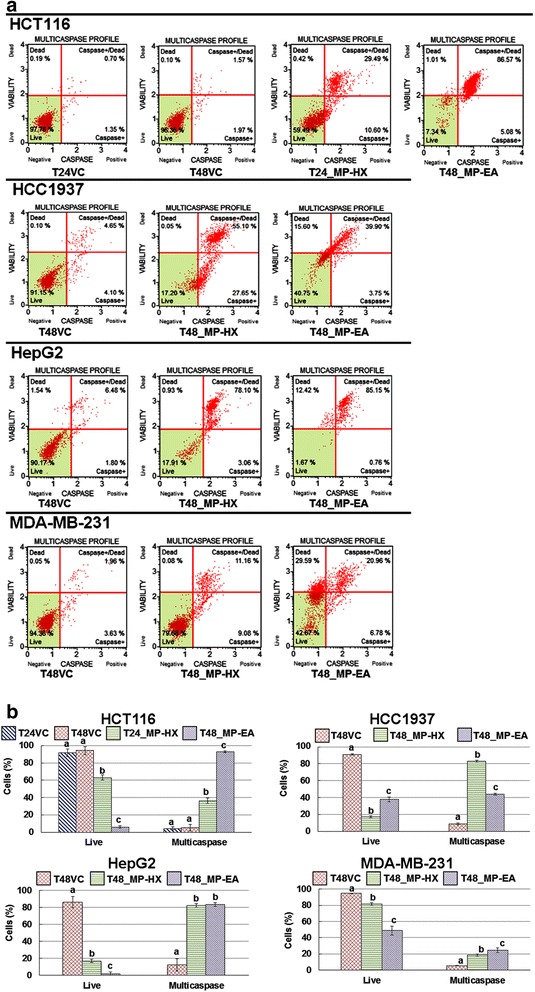
Fig. 6.

Cell viability and multicaspase enzyme activation assays. (a) The plots depict the effect of MP-HX and MP-EA treatments in the cancer cell lines indicated. Each plot is a representative figure of the three replicates of each determination. (b) The bar charts depict the percentage of live cells and those with multicaspase enzyme activation. The concentration of the extracts used in each treatment was at ~IC50 value for the corresponding cell lines indicated. T24/T48, 24 or 48 h treatment, respectively. VC, vehicle control. Values are mean ± SD (n = 3). The values with different letters (a-d) are significantly different, p < 0.05
