
Fig. 7.
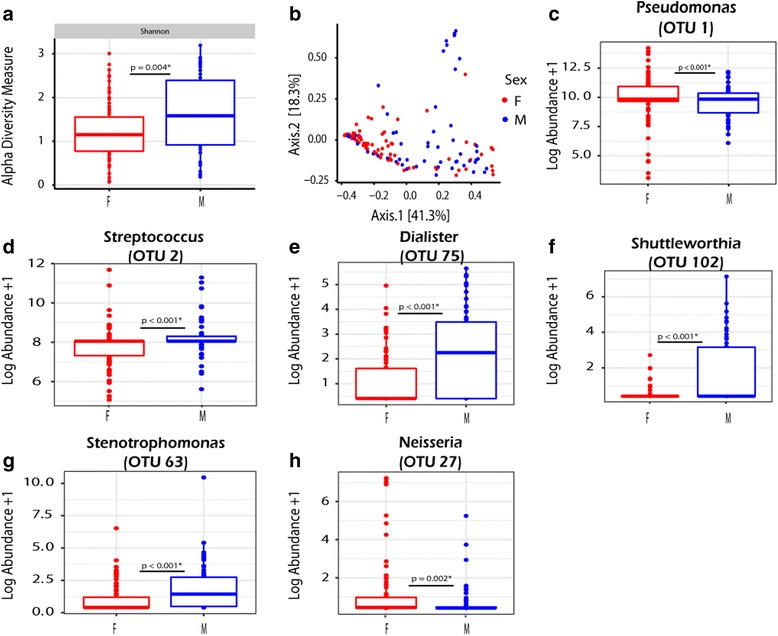
Analysis of samples collected from males (n = 56) vs females (n = 76). a Males have a higher alpha diversity measure as measured by the Wilcoxon rank-sum test. b Similarly significant differences were observed in PERMANOVA testing (p = 0.001*) as demonstrated by clustering in the Bray-Curtis PCoA plot. However, significance is lost when permutations are constrained by patients (p = 1.0). c–h Significant differences in the log abundance at the OTU level for organisms present in >20% of samples, as demonstrated by Wilcoxon rank-sum statistical analyses