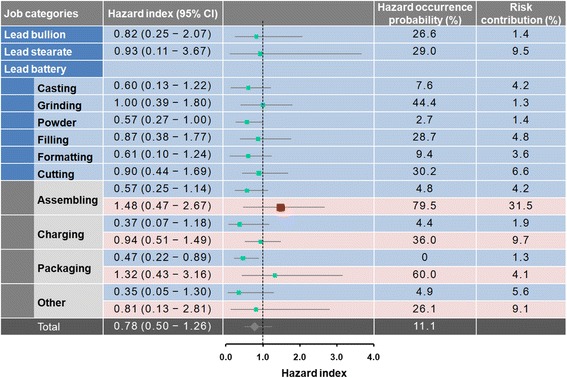
Fig. 4.

Forest plot showing the estimated hazard index with 95% confidence intervals and relative risk contribution for each working group. Female workers are represented by light gray

Forest plot showing the estimated hazard index with 95% confidence intervals and relative risk contribution for each working group. Female workers are represented by light gray