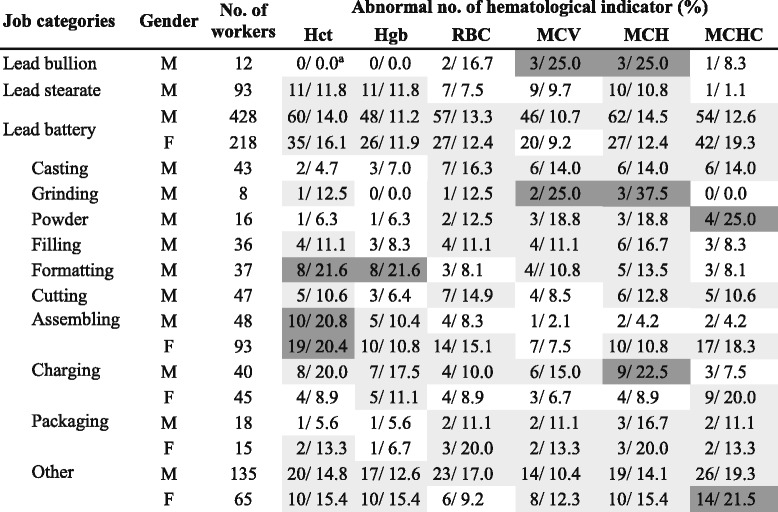
Table 2.
Job-specific number of workers and the related abnormal number of hematological indicators in each job

aPercentage (%)
(white: <10%, light gray: 10–20%, and dark gray: > 20%)
Job-specific number of workers and the related abnormal number of hematological indicators in each job

aPercentage (%)
(white: <10%, light gray: 10–20%, and dark gray: > 20%)