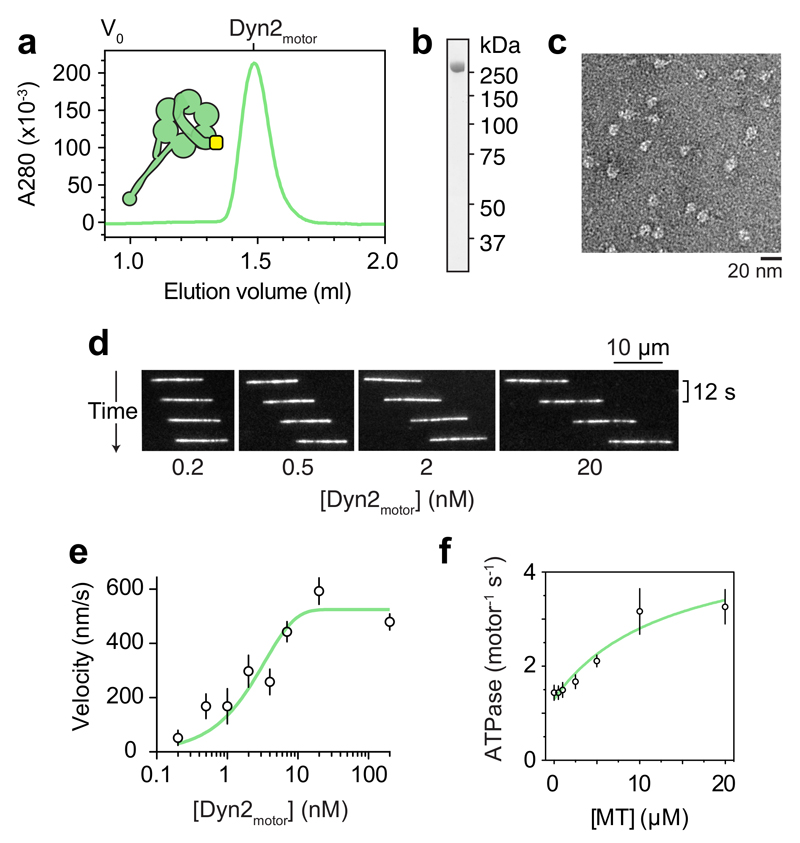
Figure 2. Monomeric dynein-2 motor domains power fast microtubule gliding.
(a) Size-exclusion chromatogram of Dyn2motor and schematic of the construct. V0; void volume.
(b) SDS-PAGE of Dyn2motor after the final purification step.
(c) Negative stain EM of Dyn2motor monomers in ATP.
(d) Time sequence of microtubule translocation by surface immobilized Dyn2motor at different input concentrations. See also Supplementary Video 1.
(e) Plot of mean microtubule gliding velocity (± SD) at different Dyn2motor concentrations. Fitted values (± standard error of the fit): Vmax = 524.0 ± 7.5 nm/s, f = 0.3 ± 0.01. Number of microtubules analyzed per concentration: 0.2 nM (38), 0.5 nM (44), 1 nM (39), 2 nM (47), 4nM (49), 7 nM (46), 20 nM (56), 200 nM (53).
(f) Microtubule stimulated ATPase activity of Dyn2motor. Experiments were carried out in triplicate, mean values (± SD) are shown. Fitted values (± standard error of the fit): kcat = 4.8 ± 0.9 s-1, kbasal = 1.3 ± 0.1 s-1, Km(MT) = 13.5 ± 7.5 μM. Source data for e-f are available online.

