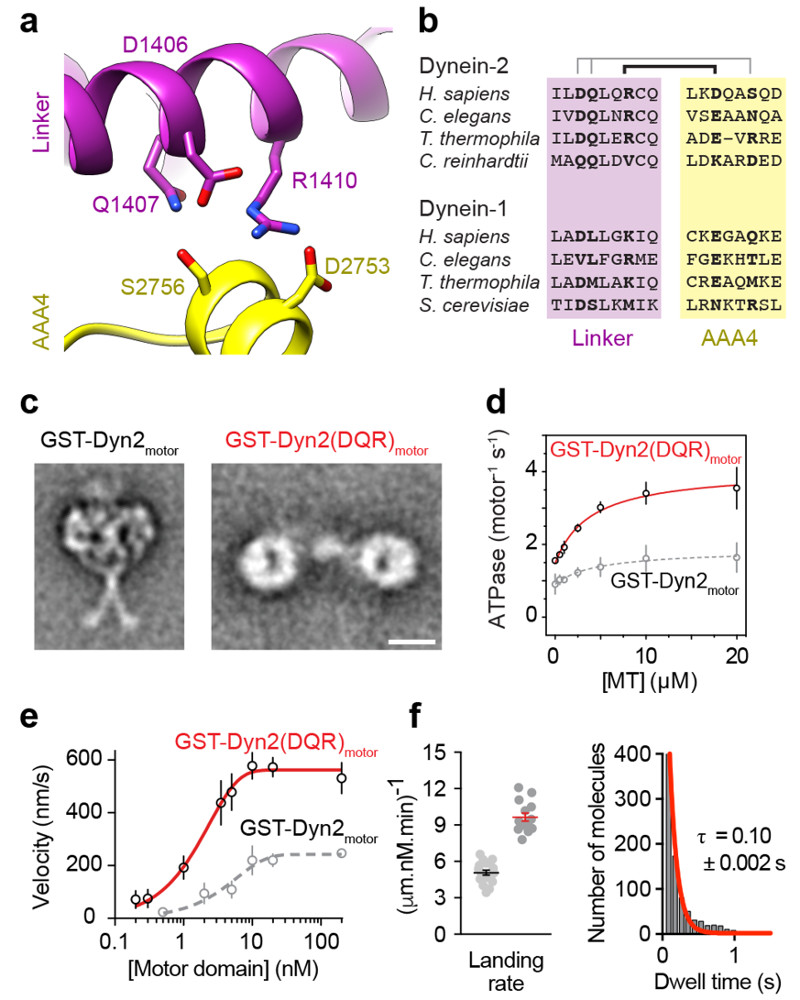
Figure 5. Untrapping dynein-2 dimers rescues their motility.
(a) Depiction of amino acids within the linker and AAA4 module of dynein-2 predicted to form intermolecular hydrogen bonds crucial for stacking based upon the model of Fig. 4c.
(b) Amino acid conservation of residues shown in (a) among cytoplasmic dynein-1 and dynein-2 sequences. Pairs of interacting residues are indicated.
(c) EM class averages of GST-Dyn2motor and GST-Dyn2(DQR)motor in ATP conditions. Scale bar; 10 nm.
(d) Microtubule-stimulated ATPase activity of GST-Dyn2(DQR)motor (GST-Dyn2motor values from Fig. 3e plotted in grey for comparison). Experiments were carried out in triplicate, mean values ± SD are shown. Fitted values (± standard error of the fit): kcat = 4.1 ± 0.2 s-1, kbasal = 1.5 ± 0.1 s-1, Km(MT) = 3.9 ± 1.2 μM.
(e) Plot of mean microtubule gliding velocity (± SD) at different GST-Dyn2(DQR)motor concentrations (GST-Dyn2motor values from Fig. 3d plotted in grey for comparison). Fitted values (± standard error of the fit): Vmax = 562.2 ± 4.7 nm/s, f = 0.4 ± 0.01. Number of microtubules analyzed per concentration: 0.2 nM (29), 0.3 nM (34), 1 nM (31), 3.5 nM (20), 5 nM (34), 10 nM (53), 20 nM (46), 200 nM (42).
(f) (Left) Quantification of microtubule landing rate for GST-Dyn2(DQR)motor. Red line; mean ± SEM. Number of landing rates: 14, from a total of 956 landing events over 14 microtubules. Data for GST-Dyn2motor from Fig. 3f are shown alongside for comparison (black line). (Right) Histogram of GST-Dyn2(DQR)motor dwell times on the microtubule, and single-exponential decay fit (red). Number of dwell times: 945. Tau; average dwell time (decay constant-1) ± standard error of the fit. Source data for d-f are available online.

