Fig. 5.
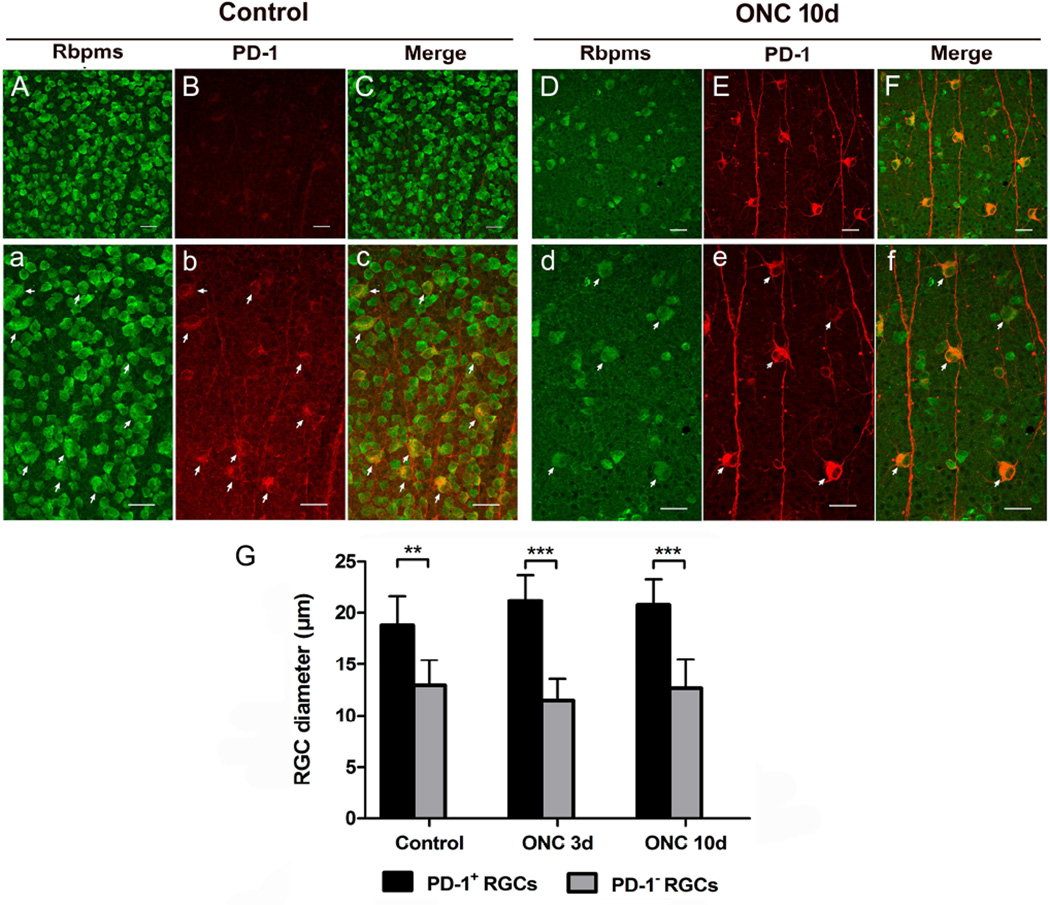
Colocalization of PD-1 and Rbpms immunolabelled RGCs in the normal and injured retinas. A, B, C) Images of normal whole mount retina immunostained with RGC marker Rbpms (green) and anti-PD-1 antibody (red) and merged picture of both. Scale bars, 30µm. a, b, c) High-magnification images of Fig. A, B, C. To visualize PD-1 expression pattern in the normal retina, Fig. 4B was shown in a larger version with enhanced intensity (b). Merged picture showing colocalization of PD-1 with a subtype of RGCs (arrows, c), which appeared to be larger than their neighboring RGCs. Scale bars, 30µm. D, E, F) Images of injured retina immunostained with Rbpms (green) and anti-PD-1 antibody (red) 10 days after ONC. Scale bars, 30µm. d, e, f) High-magnification images of Fig. D, E, F. Same situation was found, that PD-1 up-expressed RGCs were larger than PD-1 negative RGCs (arrows). Scale bars, 30µm. G) Quantitatively, measurement of cell diameter revealed that in both normal and injured retinas, somata size of PD-1 up-expressed RGCs were significantly larger than PD-1 negative RGCs, in which PD-1 is undetectable using current methodology. 3 animals were included in each group and time point. Data were presented as mean ± SD. Images for quantitative analysis were captured randomly. T-test, **p < 0.01, ***p < 0.001.

