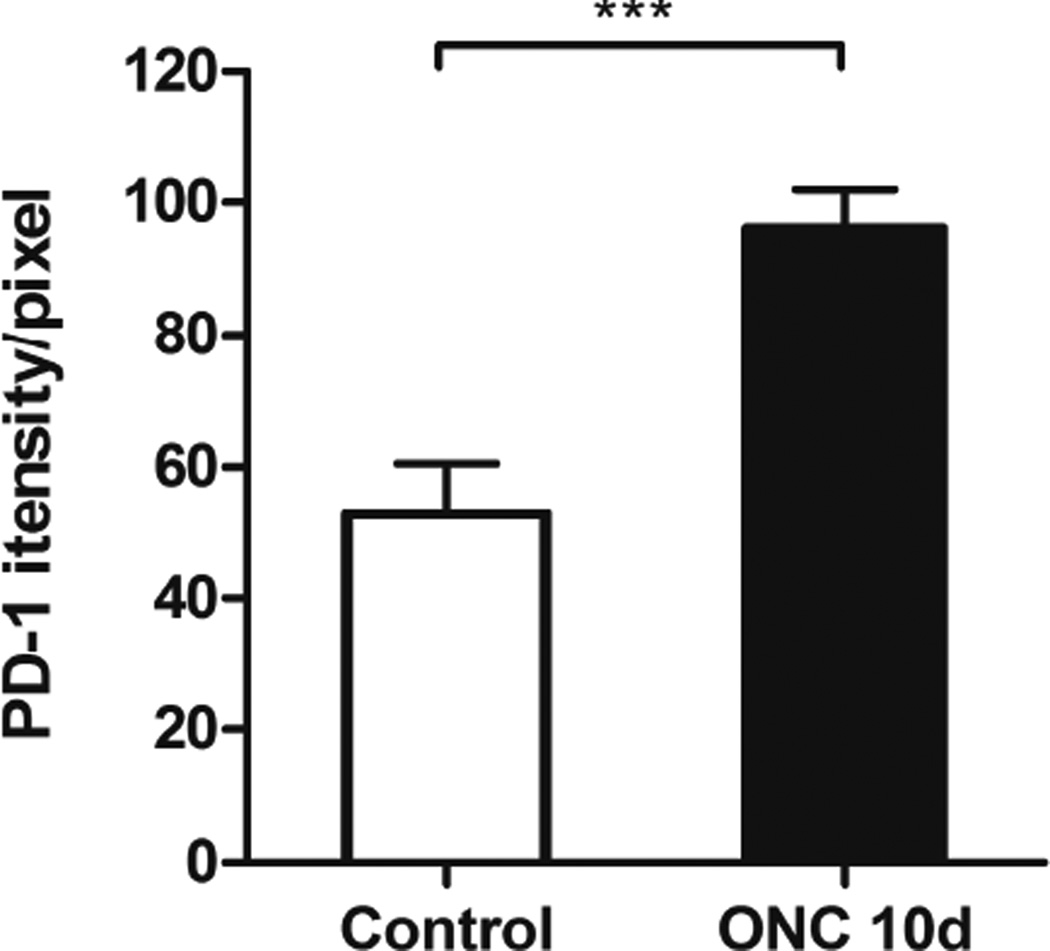
Fig. 6.
Quantitative analysis of PD-1 staining intensity in large RGCs in control and injured retinas. Bar graphs showing average intensity value of PD-1 staining in large RGCs (see Fig. 3E, F) in the control and injured retinas, suggesting an increase of estimated 80% in staining intensity in injured RGCs compared to that in normal RGCs. N = 4 animals were used in each group, a total of n = 121 (control) and n = 88 (ONC) cells were examined. Data were presented as mean ± SD. T-test, ***p < 0.001.

