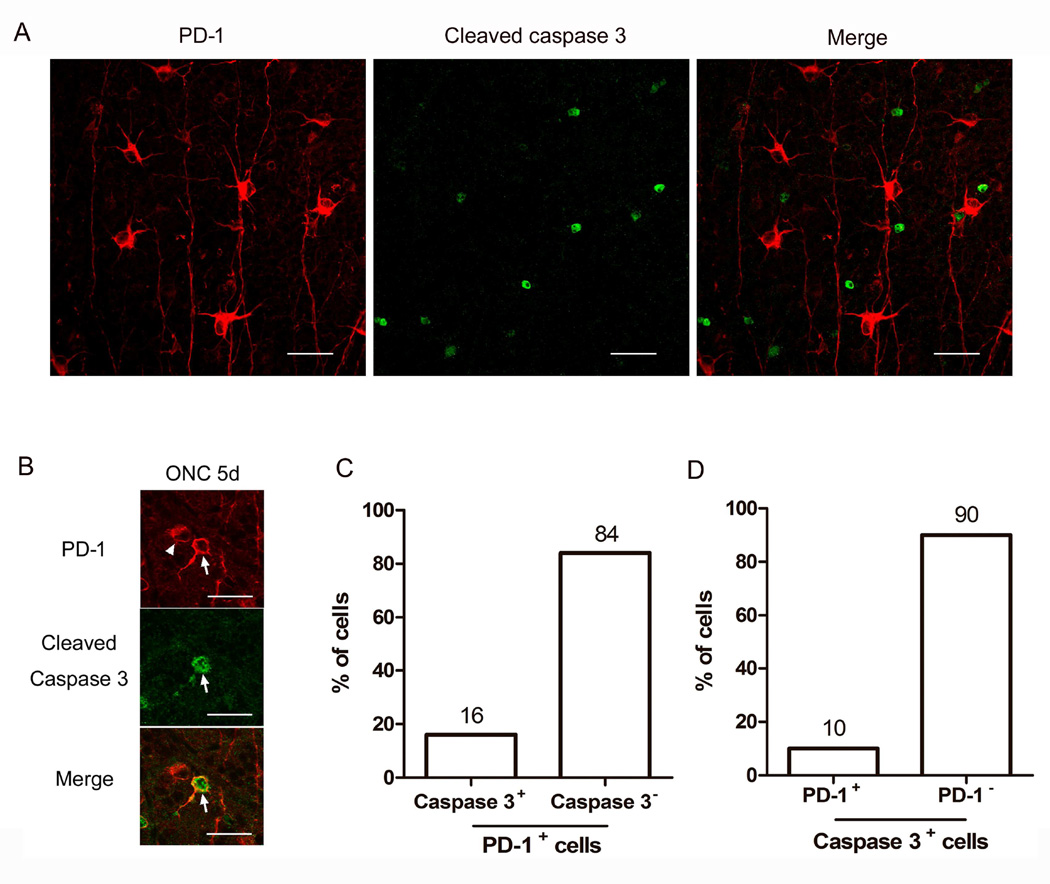
Fig. 7.
Double staining of PD-1 and cleaved-caspase-3 in injured retina at 5 days after ONC. A) Representative photographs of PD-1 (red) and cleaved-caspase-3 (green) staining on whole mount retina 5 days after ONC, showing a field in which none of the PD-1 positive large RGCs (see Fig. 2F) expressed cleaved-caspase-3. B) This image shows two smaller RGCs, one of which expresses both PD-1 and cleaved caspase-3 (arrow), the other one only contain PD-1 (arrow head). Scale bars, 30µm. C, D) Graphs showing the percentage of PD-1 positive cells that either express or do not express cleaved-caspase-3 (C), or the percentage of cleaved-caspase-3 positive cells that either express or do not express PD-1 (D). 3 animals were used in each group, and the images for quantitative analysis were captured randomly from whole mount retinas.

