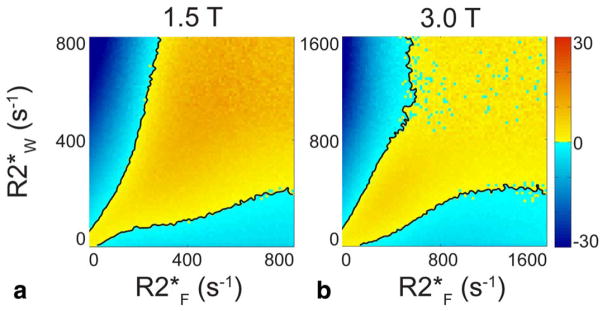
FIGURE 4.
Single-R2* outperforms dual-R2* for most combinations of R2*F and R2*W in Monte Carlo simulation. The plots show the difference between dual-R2* RMSE and single-R2* RMSE. The black lines are the contours where single-R2* RMSE is equal to dual-R2* RMSE; in the yellow regions between the contours, single-R2* RMSE is lower than dual-R2*. PDFF = 20% and SNR = 20 are fixed values, while R2*W and R2*F independently vary over 0–800 s−1 at 1.5T. RMSE difference is plotted for both (a) 1.5T and (b) 3.0T. At 3.0T, R2*W and R2*F independently vary over 0–1600 s−1, which corresponds to the 0–800 s−1 range at 1.5T. When both R2*F and R2*W are very high, the calculation suffers from high variability as seen in the noisy blue appearance.

