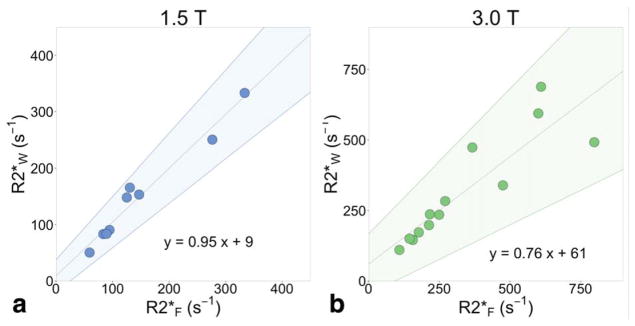
FIGURE 6.
Water and fat decay rates increase similarly in the presence of increasing liver iron. Spectroscopy R2*F is plotted against spectroscopy R2*W at (a) 1.5T, and at (b) 3.0T. The width of each water and fat (methylene) peak was measured from a two-peak Lorentzian fit to spectroscopy, and converted to s−1. Cases were limited to those with spectroscopy PDFF > 5.6%, and a visible fat peak on the first spectroscopy echo (8 at 1.5T and 13 at 3.0T). The shaded areas signify 95% limits of agreement from the linear regression slope (0.76 to 1.13 at 1.5T, 0.52 to 1.02 at 3.0T) and intercept (−22 to 45 at 1.5T, −43 to 148 at 3.0T).

