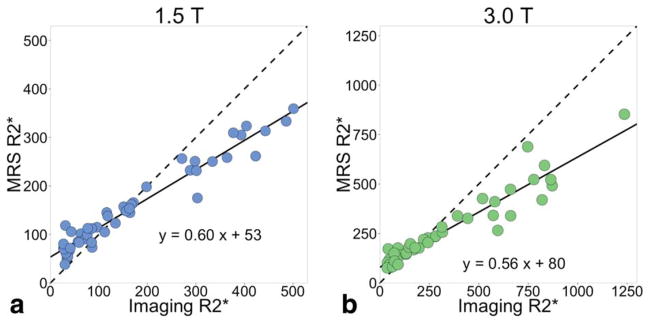
FIGURE 7.
Spectroscopy R2* is smaller than imaging R2* at high iron levels. The spectroscopy R2* is measured from the linewidth of the water peak in a two-peak Lorentzian fitting process. The imaging R2* results from single-R2* complex fitting. The solid line is the linear regression and the dashed line is y = x. The slopes from the linear regressions at both field strengths are less than 1 (0.60 at 1.5T and 0.56 at 3.0T). At low iron levels, R2*W,spectro > R2* imaging, while at high iron levels, R2*W,spectro < R2* imaging. (a) At 1.5T, r2 = 0.96, the slope is significantly different from 0 with P < 2 × 10⁻¹⁶; (b) at 3.0T, r2 = 0.91, and the slope is significantly different from 0 with P < 2 × 10⁻¹⁶.

