
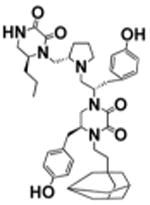
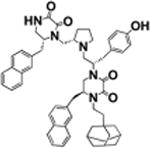
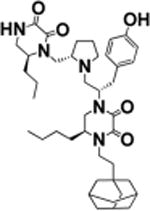
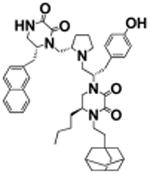
Table 3. SAR Study Results of Individual Compounds Synthesized Based on Positional Scan of Mixture Samplesa.
| Sample # | STRUCTURE | R3 | ADAM10 IC50, μM | ADAM 17 1C50, μM |
|---|---|---|---|---|
| Core |

|
N/A | N/A | N/A |
| 6 |
|
S-4-hydroxybenzyl | >100 | 5.9 ± 0.9 |
| 8 |

|
R-4-hydroxybenzyl | >100 | 5.4 ± 0.5 |
| 12 |

|
S-4-hydroxybenzyl | >100 | 8.1 ±0.9 |
| 13 |

|
R-4-hydroxybenzyl | >100 | 15 ±1.2 |
| 9 |

|
S-5-naphthalen-2-ylmethyl | >100 | 10 ± 0.8 |
| 10 |

|
R-5-naphthalen-2-ylmethyl | >100 | 7.9 ± 0.8 |
| 14 |
|
S-5-naphthalen-2-ylmethyl | >100 | 8.4 ± 1.0 |
| 15 |

|
R-5-naphthalen-2-ylmethyl | >100 | 5.7 ±1.0 |
| 11 |
|
S-5-butyl | >100 | 6.5 ± 0.9 |
| 16 |
|
S-5-butyl | >100 | 5.7 ± 0.8 |
a
R3 is scanned, and R1, R2, and R4 are fixed. IC50 values data reported as a mean of three experiments ± standard deviation.