
Figure 1.
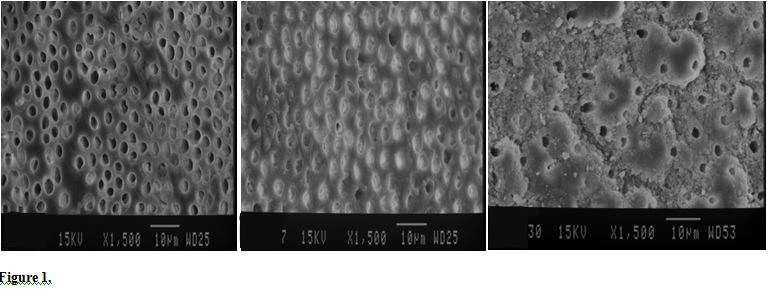
Scanning Electron Micrographs of the Root Canal Regions in the Control Group (×1500) (A: Coronal, B: Middle, C: Apical).
Official websites use .gov
A
.gov website belongs to an official
government organization in the United States.
Secure .gov websites use HTTPS
A lock (
) or https:// means you've safely
connected to the .gov website. Share sensitive
information only on official, secure websites.
Scanning Electron Micrographs of the Root Canal Regions in the Control Group (×1500) (A: Coronal, B: Middle, C: Apical).