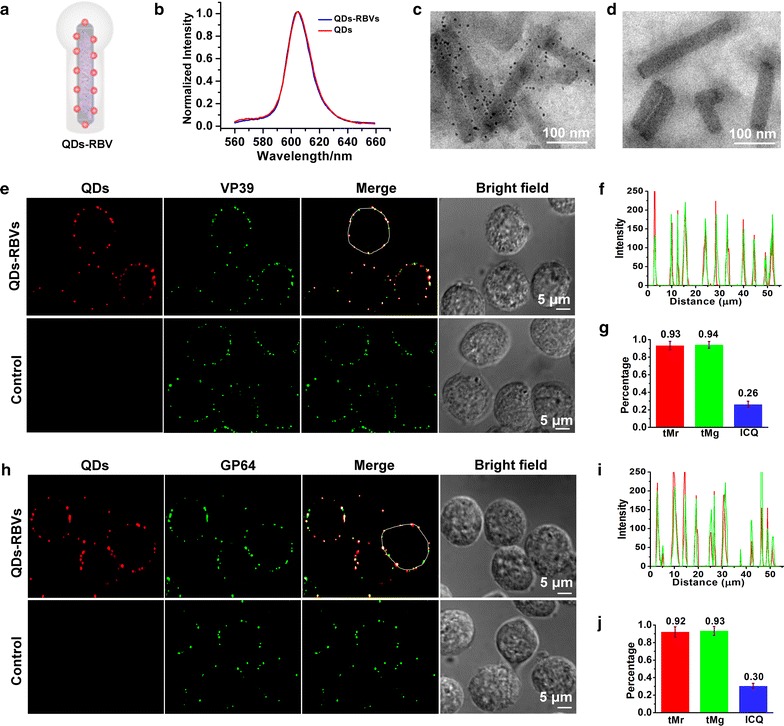
Fig. 1.

Characterization of QDs-RBV. a Scheme of QDs-RBV. b Fluorescence emission spectra of QDs and QDs-RBVs. TEM images of QDs-RBVs (c) and WBVs incubated with SA-QDs (d). Fluorescence colocalization of QDs with immunolabeled VP39 (e) and immunolabeled GP64 (h) of QDs-RBVs attached to Sf9 cell. Control: WBVs incubated with SA-QDs. f, i Line profiles of the red and green signals distributed on the white circles shown in e and h, respectively. g, j Histograms for Manders coefficients tMr and tMg, and ICQ values corresponding to e and h, respectively
