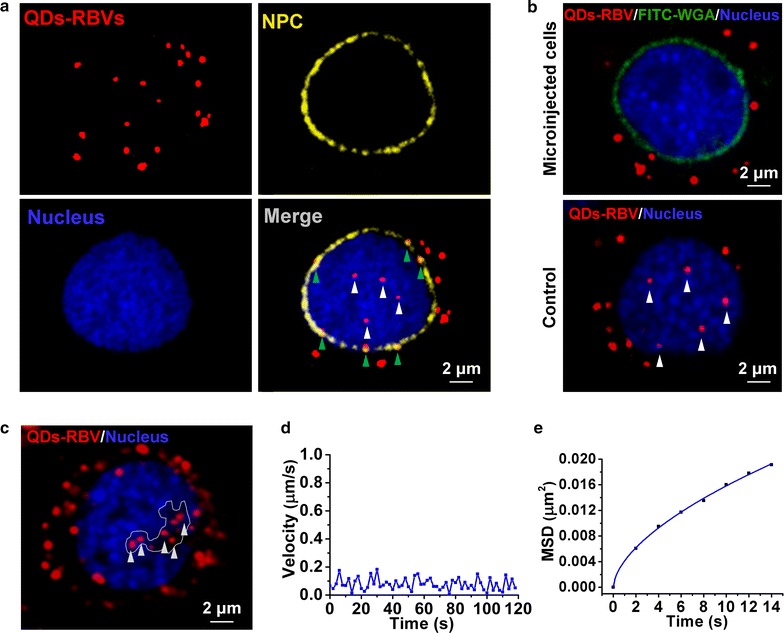
Fig. 5.

Interaction between QDs-RBVs and nucleus. a Fluorescence images of QDs-RBVs, immunolabeled NPC, Hoechst 33342-labeled nucleus and their merge in Sf9 cells. b Fluorescence images of QDs-RBVs in Sf9 cell microinjected with or without (the control) FITC-WGA. c Fluorescence images of QDs-RBVs confined in the non-nucleic acids area (white-line defined) of nucleus. Typical velocity vs time plots (d) and MSD vs time plots (e) of the arrowed QDs-RBVs shown in c. The curve in e is the fit to
