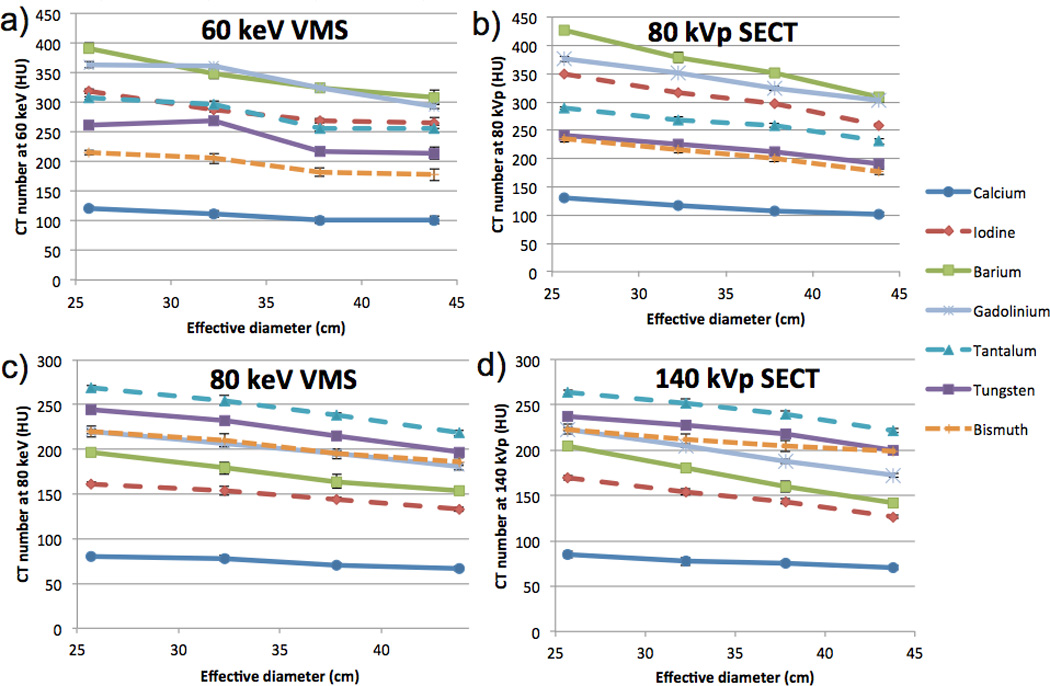
Figure 2.

CT number versus effective phantom diameter for the seven contrast elements. a) CT number at 60-keV VMS from DECT. b) CT number at 80-kVp from SECT. c) CT number at 80-keV VMS from DECT. d) CT number at 140-kVp from SECT. Error bars represent the +/− the standard deviation among the 10 measurements taken for each data point, and are generally too small to see in these plots.
