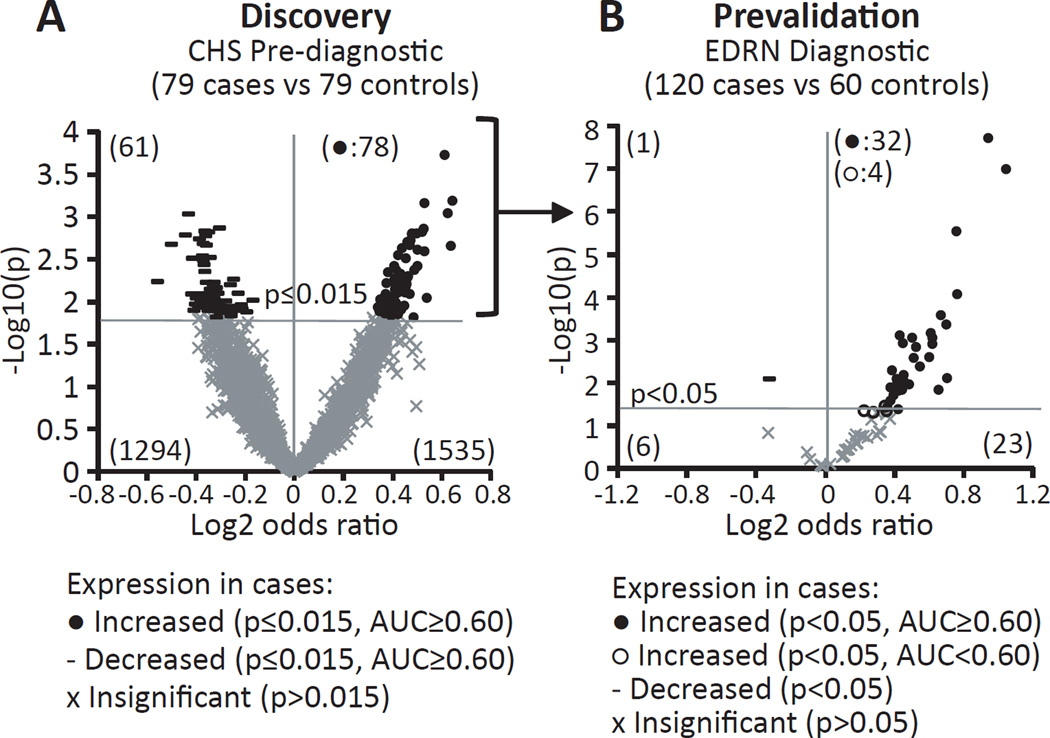
Figure 1. Volcano scatter plots presenting proteomic expression and statistical significance of antibody array-analyzed markers.
Data showing case-control differences in protein levels as tested with 3,600 antibodies using prediagnostic and diagnostic plasma sets. The X-axis represents the magnitude of change by log2 odds ratio (OR) and the y-axis indicates statistical significance as −log10 of p-value. A positive OR means that the marker was increased in cases with a filled circle indicating it reached statistical significance and area under the curve (AUC) above 0.60. Non-significant markers are indicated by an X and the significantly decreased marker by a –. (A) Data from prediagnostic samples consisting of 79 cases (draw <3 years prior to diagnosis) and 79 matched controls. A cut off of p≤0.015 was applied for marker selection yielding 78 markers. (B) Performance of these 78 upregulated markers from A were tested in 120 case (30 adenomas, 30 advanced adenomas, 30 stage I–II and 30 stage III–IV cancers) and 60 control diagnostic samples. A cut off of p<0.05 was applied and significance and direction are indicated as in A. Unfilled circles were significant by p values but had an AUC below 0.60.

